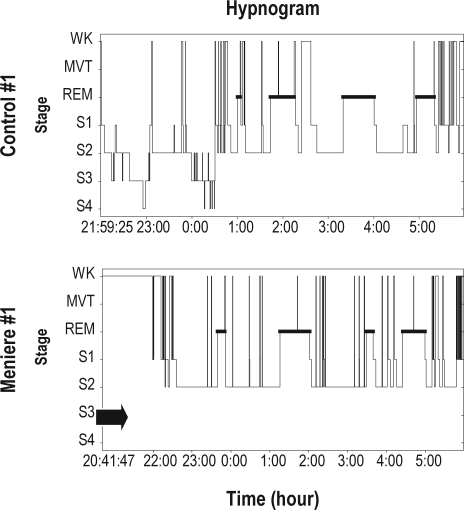
Figure 6.
A hypnogram of a control and patient. While the control (above) shows all sleep stages (S1-S4 and REM sleep), there is a complete deficit (arrow) of S3 and S4 in the patient (below). wk = wake, mvt = movement time, S1 = sleep stage 1, S2 = sleep stage 2, S3 = sleep stage 3, S4 = sleep stage 4.

