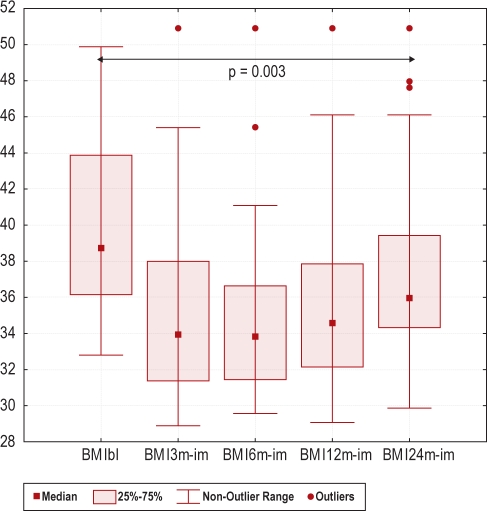
Figure 2.
Box-plots showing Body Mass Index (BMI) at baseline (bl) and after a 3, 6, 12 and 24 months (3m, 6m, 12m, and 24m) weight reduction program with an imputated (im) worsening with one unit between baseline and follow-up for the dropouts (intention to treat analysis, Wilcoxon Sign Rank test, n = 33).

