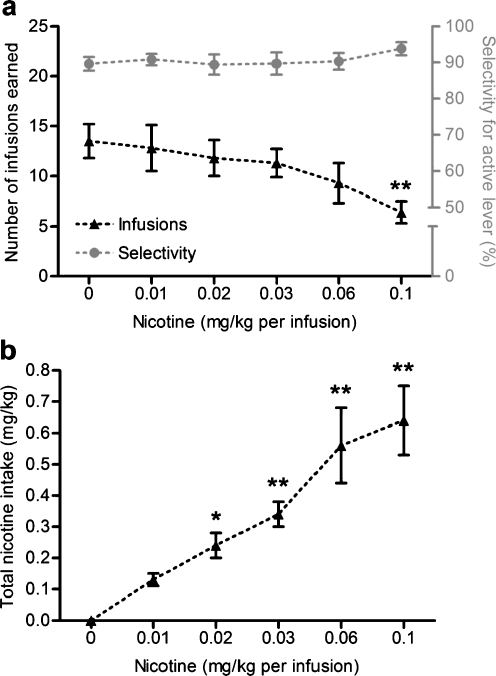
Fig. 1.
Experiment 1. Dose-response curve of intravenous nicotine self-administration under a fixed-ratio 3 (FR3) schedule of reinforcement. a Number of reinforcers earned during the 1-h self-administration session (lower black trace, left Y-axis) and selectivity for the active lever (upper gray trace, right Y-axis). b Total nicotine intake expressed in milligrams nicotine per kilogram body weight. Results are expressed as mean ± SEM (n = 13). Data were subjected to repeated-measures ANOVA or Friedman's test followed by post hoc comparisons with the 0 mg/kg/infusion dose (saline infusion; *p < 0.05, **p < 0.01)

