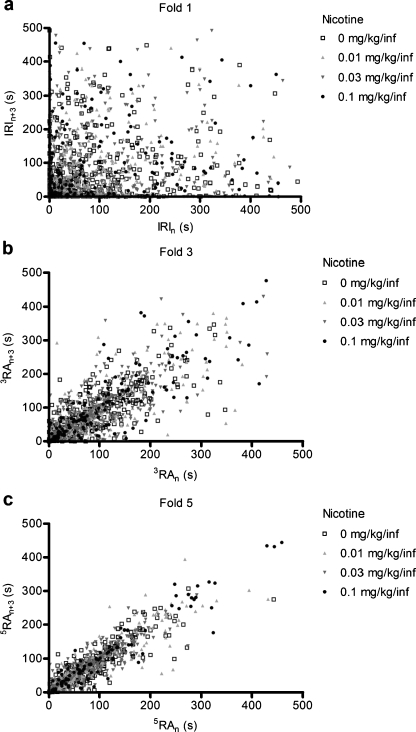
Fig. 8.
Return maps of IRIs and running averages in mice self-administering different doses of nicotine (experiment 1). a Standard (fold 1) lag 3 return map. b Fold 3 extended return map. c Fold 5 extended return map. Data were subjected to linear regression analysis to determine the slope, intercept, and goodness of fit of the best fitting line

