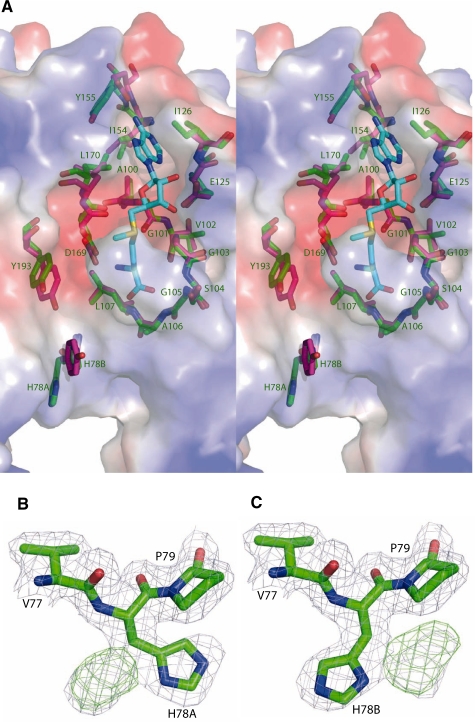
Figure 5.
(A) Superposition of the SAM-binding pockets of TtTrmI (in pink) and PabTrmI (in green) on the electrostatic surface of PabTrmI determined using PYMOL/APBS colored by the electrostatic potential (Stereoview). The values of surface potential are expressed as a spectrum ranging from –63 kT/e (deep red) to +63 kT/e (deep blue). The labels correspond to the PabTrmI amino acids. (B) and (C) His78 displays two different conformations in Crystal Form I. 2 Fobs–Fcalc and Fobs–Fcalc electron density maps contoured at the level of 1 and 2 SDs, respectively, are shown in blue and green, respectively.

