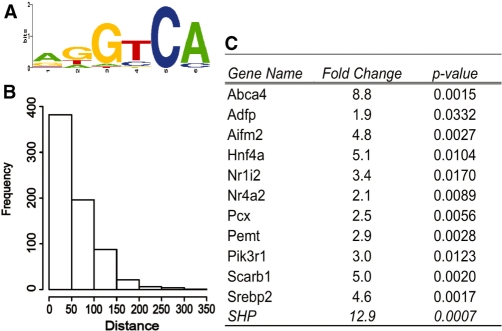
Figure 6.
Co-regulator analysis. (A) Co-regulatory DNA-binding motif identified along with FXR-binding motif. The IR-1 elements in each FXR peak were masked and then FXR-binding peaks were searched for motifs located within 150 bp on either side of each peak. (B) Distance from the best IR-1 site to midpoint of closest additional NR half site. (C) qPCR analysis of 12 peaks for LRH-1 binding. Results are presented as fold change from control as in Supplementary Figure 1.

