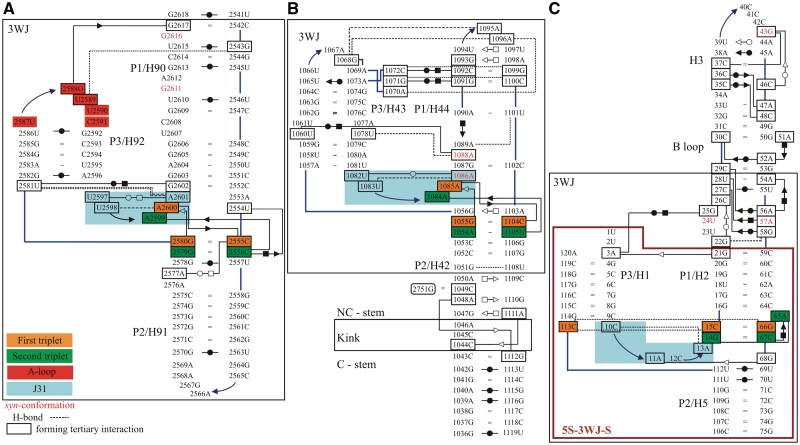
Figure 3.
Base pairing in the X-ray structures of the simulated systems using symbols for base pairs by Leontis et al. (29): (A) H90–H92 from the 23S rRNA of H. marismortui (36) (simulation Hm_A-site; cf. Table 1 for the respective simulation names), (B) H42–H44 from the 23S rRNA of E. coli (62) (simulations Ec_GAC_B and Ec_GAC_4) and (C) H1–H3 and H5 from the 5S rRNA of H. marismortui (91) (simulation 5S_L). The large black boxes define the 3WJ parts (3WJ residues, see also Table 1) of the simulated structures. For the H42–H44 system, we also indicate positions of the Kt with its attached C and NC-stems. Control simulation 5S_S was executed for a smaller system, which is marked by the large purple box. The backbone is represented by blue lines, while other single H-bonds are represented by black dashed lines. Residues in black boxes are involved in tertiary interactions. The residues forming J31 parts are demarcated by blue rectangle area. Nucleotides in syn-conformation are written in red. The 3WJs contain essential base triplets, usually represented by A-minor I (first triplet) and A-minor II (second triplet) interactions, which are marked by orange and green rectangles, respectively. In the 5S 3WJ, the A-minor II interaction is replaced by equivalently positioned CCG triple and A-minor I interaction by cis H/SE base pair C67/A65 (Supplementary Figure S2). G2751 in (B) comes from H97 and was included only in some simulations (see Table 1 for detailed description). The E. coli A-site and H. marismortui GAC systems are shown in Supplementary Figure S3. To avoid cluttering, base–phosphate interactions are not shown (92).

