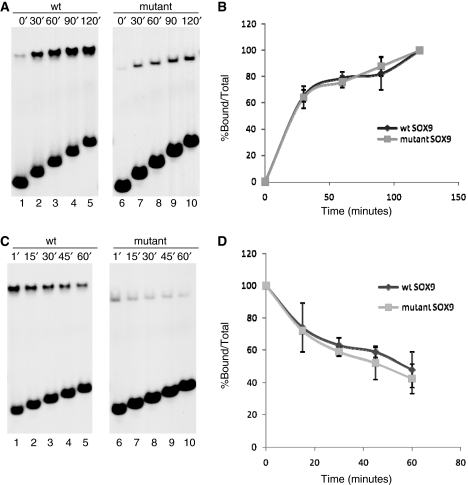
Figure 3.
Comparison of on-rates and DNA binding stability of wild-type and mutant SOX9 proteins. (A) Comparison of the on-rate of wild-type and mutant SOX9 binding. Wild-type and mutant SOX9 proteins were incubated for indicated lengths of time with the 31-bp Col2a1 probe. Aliquots were removed from the reaction at the indicated times and analyzed in EMSA. (B) Amounts of protein–DNA complexes present at each timepoint were measured using a Phosphoimager and plotted as percentage of the complexes found at the end of the 2-h incubation. Similar results were obtained in three different experiments. (C) Comparison of the stability of wild-type and mutant SOX9–DNA complexes. SOX9–DNA complexes were allowed to form for 2 h and challenged by a 25-fold excess amount of cold competitor oligonucleotides for indicated lengths of time. Aliquots were removed from the reaction at the indicated times and analyzed in EMSA. (D) Amount of protein–DNA complex present at each timepoint was determined using a Phosphoimager and computed as a percentage of the amount at the time the competitor was added.

