Figure 3.
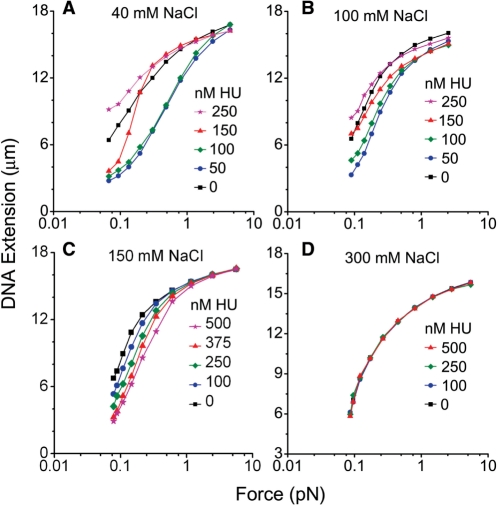
Force-extension curves of HU–DNA complexes. Each data point represents the average of 6–10 measurements. (A) HU-dependence of force-extension curve of a λ-DNA in 40 mM NaCl buffer. Force-extension curve shifted to higher force if the added HU concentration was <250 nM, signifying the formation of flexible hinges. The curve moved to lower force if HU was >250 nM, exhibiting the formation of rigid filaments. (B) HU-dependence of force-extension curve as in A, for 100 mM NaCl. The same ‘bimodal’ behavior was observed as in 40 mM NaCl. (C) Extension in 150 mM NaCl buffer. Force-extension curve continuously shifted to lower force as the HU concentration increased. (D) Force-extension remained unchanged for all HU concentrations in 300 mM NaCl.

