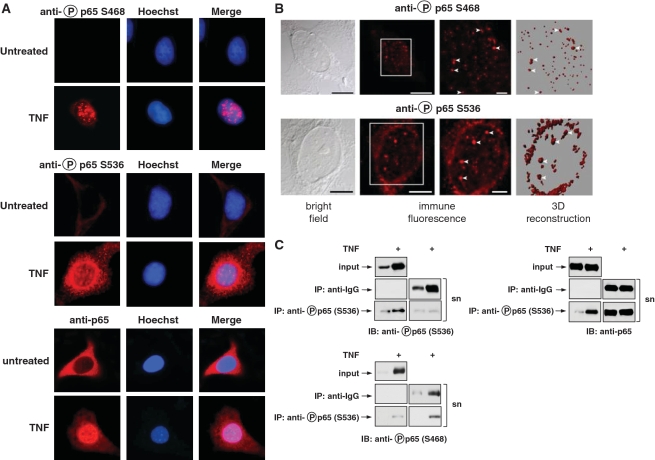
Figure 2.
Intracellular distribution of p65 phosphorylation. (A) HeLa cells were left untreated or stimulated with TNF for 30 min. The subcellular localization of endogenous p65 or its phosphorylated forms was visualized by indirect immunofluorescence using anti-phospho-S468, anti-phospho-S536 or anti-p65 antibodies (red). Nuclear DNA was revealed by Hoechst staining. (B) HeLa cells were stimulated for 30 min with TNF and further analyzed by confocal microscopy. A bright field picture, two magnifications of immunofluorescence pictures and a three-dimensional reconstruction of the same cell are displayed. The Z-stack pictures were processed using the Imaris software package for surface rendering. To facilitate the orientation, white arrow heads point to speckles that are displayed by immunofluorescence and also by 3D reconstruction. (C) HeLa cells were stimulated with TNF for 30 min as shown. Lysates were subjected to immunoprecipitation (IP) with anti-IgG control or anti-phospho-p65-S536 antibodies. The input, supernatant (sn) and the immunoprecipitated proteins were further analyzed by western blotting using anti-p65 or phospho-specific antibodies recognizing serine 468 or 536.

