
Figure 2.
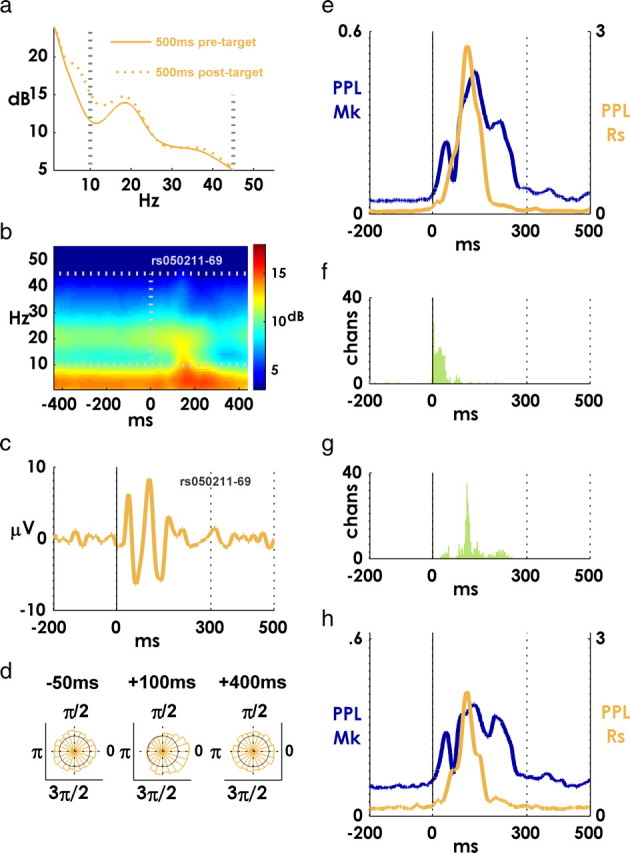
Phase-locking of beta-LFP to target appearance. a, Mean spectrum over all channels for monkey Rs. The solid line is spectrum for 400 ms preevent period, and the dotted line is the spectrum for the 400 ms postevent period. A 10–45 Hz window is indicated with vertical dotted lines. A “beta bump” in the spectrum is visible around 20 Hz. b, Perievent spectrogram for a single beta-LFP channel computed using a 128 ms Hamming window at 10 ms steps. Robust beta activity is visible throughout the perievent period. c, Mean peritarget beta-LFP for the channel in b. d, Phase distributions over all targets for the same channel in c at three perievent latencies. e, Mean PPL averaged over all channels and sessions for each monkey (blue trace and left y-axis, monkey Mk; orange trace and right y-axis, monkey Rs). The higher values indicate that the phase distribution across targets is less uniform. f, Histogram of onset latencies of phase locking (significant elevation of PPL above pretarget baseline, p < 0.001) for all channels for both monkeys. g, Histogram of PPL peak latencies for all channels for both monkeys. h, Mean PPL values over a subset of targets where the mean oscillatory amplitude stayed the same or decreased after the target appearance. The axes are the same as in e.