
Figure 3.
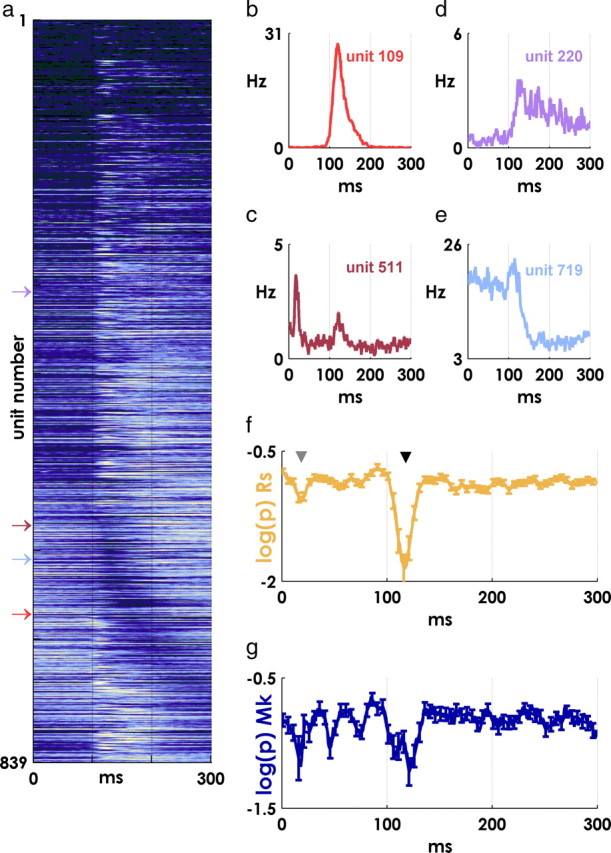
Event-related spiking. a, Mean PSTHs for all units from 0 to 300 ms after target appearance. The lighter colors indicate more activity, and the darker colors represent less firing; all PSTHs are normalized by the peak value for each unit. Units are ordered by the latency of their minimum perievent firing rate for visualization purposes. Many units display an abrupt modulation in firing at ∼100 ms after the event. b–e, Example PSTHs for four units showing the diversity of responses. The position of each unit in a is indicated by an arrow. f, Spiking precision transiently increases at characteristic latencies. Lower log(p) values at a particular latency indicate that there are more precisely timed spikes than would be expected given the background firing rate for a unit (monkey Rs; mean ± SE over all units). Two transient periods of precise spiking are visible at latencies near 15 ms (gray arrowhead) and 120 ms (black arrowhead) after the target event. g, Same result as in f for monkey Mk.