Figure 6.

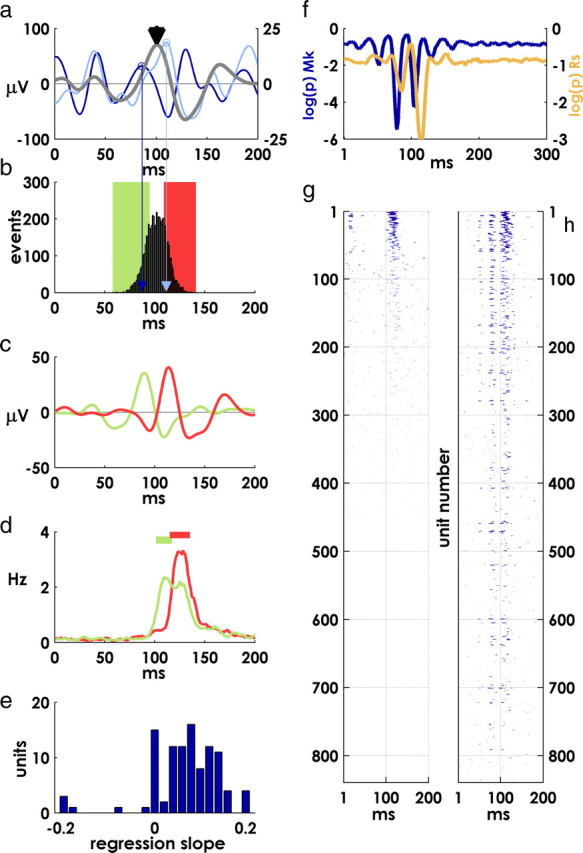
Covariation of oscillation and spike latencies and spiking precision. a, Single-channel mean beta-LFP (right y-axis, gray trace) and two examples from individual targets (left y-axis, colored traces). b, Distribution of characteristic oscillation peak times over all targets for the channel in a. Characteristic peaks are identified by proximity to the reference peak in mean LFP near 100 ms (black arrowhead in a; colored arrows indicate peak locations for single-target example traces in a). The green and red bars represent the lower and upper quartiles of the distribution. c, Averaging over the lower and upper quartiles produces an early and late mean evoked potential. d, Mean postevent firing of a unit recorded on the same electrode as the oscillation in a–c. The green and red traces are average spike rates for that unit over the lower and upper quartiles of oscillation latencies, respectively. Periods of precise spiking (p < 5 × 10⁻⁴) are indicated by horizontal lines. The latency of precise spiking mirrors the latency of the oscillation. e, Regression slopes between spike times and oscillation latencies (see Materials and Methods)—histogram of significant regression coefficients (p < 0.05). f, Subtracting LFP relative latencies from spike latencies on the same channel increases the apparent precision of postevent spiking. Log p values for each monkey after adjusting spike times by the latency of the phase-locked oscillation on the same electrode (compare with Fig. 3f,g, noting difference in scale). g, Incidence of precise spiking; mean p values for all units, thresholded at p < 0.01 before adjusting spike times. h, Thresholded mean precision of spiking as in g, after adjusting spike times as in f.
