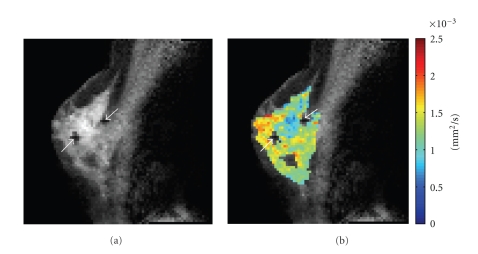
Figure 2.
ADC values are reduced in breast cancer tumors compared to the unaffected tissue. Shown here is a postcontrast T 1-weighted image (a) for reference and an overlay of the corresponding ADC map (b). The tumor, located above and between the biopsy clips (white arrows), exhibits increased signal in the T 1-weighted image and decreased ADC values, compared to the surrounding tissue.

