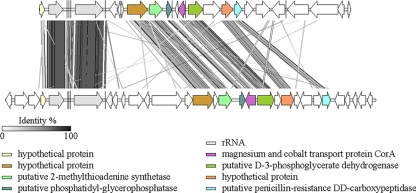
FIG. 3.
Comparative genomic organization of fosmid 253 (subdivision 4) (top) in relation to previously described fosmid 46h5 (46) (bottom). Conserved genomic regions between fosmid clones are indicated by gray-shaded areas, with gray intensity being a function of sequence similarity by tBLASTx over lengths greater than 150 bp. Particular ORFs mentioned in the text are highlighted in color.

