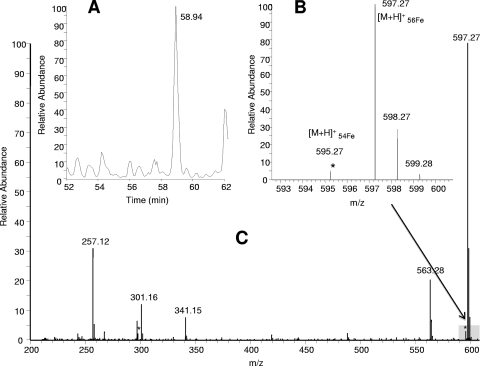
FIG. 5.
(A) The observed chromatographic peak retaining all iron-bound siderophore fragments; (B) graph using a smaller scale of the [M + H]+ results, showing the Fe-isotopic pattern observed; (C) precursor mass spectrum collected in the orbitrap Fe(III)-siderophore complex, with a molecular ion peak [M + H]+ at m/z 597.

