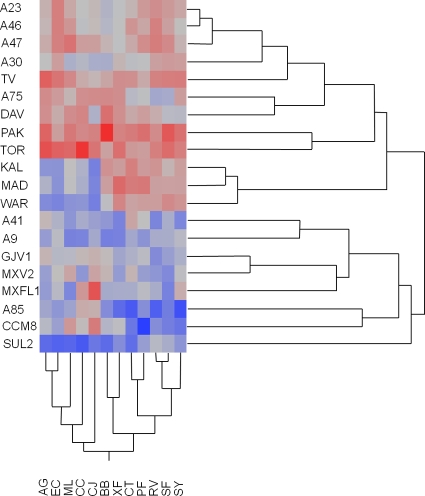
FIG. 3.
Grid of standardized predatory performance and neighbor-joining trees of predators and prey based on predation phenotypes. Red indicates faster swarming than average by a Myxococcus strain on the respective prey type, whereas blue indicates slower swarming than average, with color intensity reflecting the degree of difference from the mean. See the main text for further explanation of the figure.

