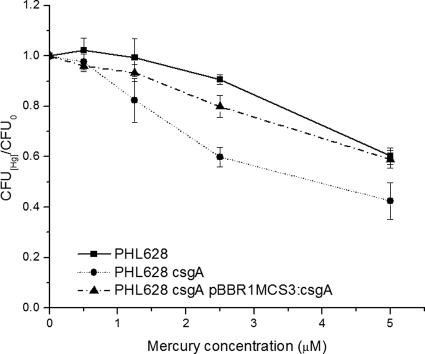
FIG. 1.
Viability curves. CFU of PHL628(pBBR1MCS3), PHL628 csgA, and PHL628 csgA(pBBR1MCS3:csgA) exposed to Hg(II) divided by the CFU of unexposed cultures plotted versus Hg concentration. Cultures were grown for 24 h at 30°C in GMM, spiked with Hg(II), and incubated for 3 additional hours before the dilutions were prepared and plated. Error bars represent standard deviations of the results for triplicate samples.

