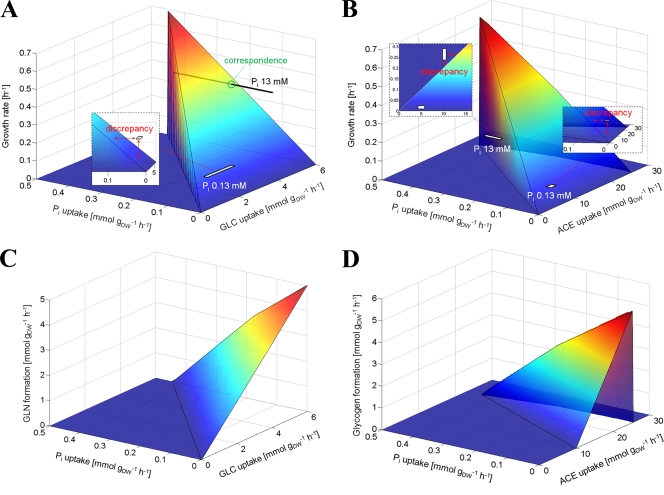
FIG. 5.
Simulated phenotypes under growth optimization of the genome-scale metabolic network model. In silico solutions of growth rates and glycogen (GLN) formation under variation of Pi uptake in combination with either glucose (GLC) uptake (A and C) or acetate (ACE) uptake (B and D) form three-dimensional surfaces in each case. For comparison, measured growth rates for Pi-limited and -excess cultures, including experimental errors, are mapped as light gray rectangles.

