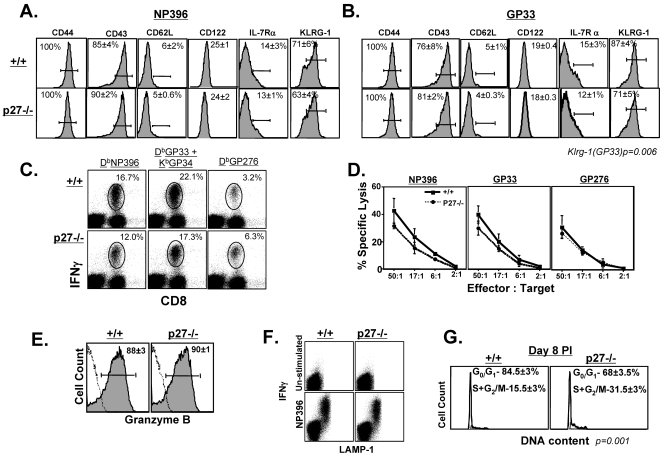
FIG. 2.
Phenotypic, functional, and cell cycle analysis of effector CD8 T cells in −/− mice. (A and B) At day 8 p.i. the cell surface phenotype of effector CD8 T cells was analyzed by flow cytometry. The histograms are gated on NP396 and GP33 tetramer-binding CD8 T cells. (C) Cytokine production by LCMV-specific effector CD8 T cells was assessed by intracellular cytokine staining. The dot plots are gated on total lymphocytes, and the numbers indicate percentages of IFN-γ-producing, LCMV-specific CD8 T cells among the total CD8 T-cell population. (D) MHC-I-restricted cytotoxic activity. CTL activity in the spleens of +/+ and −/− mice was quantitated by a 51Cr release assay. There was no significant lysis of control unpulsed target cells. (E) Intracellular granzyme B expression in NP396-specific CD8 T cells. (F) Antigen-induced degranulation. The dot plots show staining for LAMP-1 and IFN-γ and are gated on the total CD8 T-cell population. (G) Cell cycle status of LCMV-specific effector CD8 T cells. At day 8 p.i., the DNA content of NP396-specific CD8 T cells was analyzed by staining with Hoechst. The flow cytometry plots are gated on NP396 tetramer-binding CD8 T cells, and the data are representative of three independent experiments.

