FIG. 1.
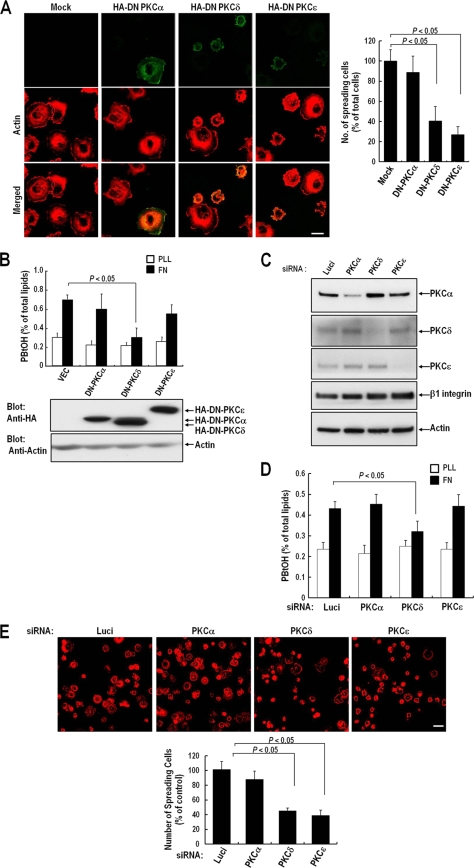
Effect of PKC inhibition on integrin-induced PLD activation and cell spreading. (A) Cells were transfected as indicated with either a pcDNA vector, dominant negative HA-PKCα (HA-DN PKCα), HA-DN PKCδ, or HA-DN PKCɛ, as indicated. One day after cDNA transfection, cells were serum starved for 24 h, detached from culture dishes, maintained in suspension for 3 h, and replated on FN for 20 min. (Left) After removal of unbound cells, the cells were fixed and stained with TRITC-labeled phalloidin or with an anti-HA monoclonal antibody in order to detect either actin or DN-PKC expression. Bars, 20 μm. (Right) Graph showing the mean numbers of spreading cells among 200 to 250 transfected cells per group. Data are means; error bars, SD (n = 3). (B) Cells were treated as for panel A. PLD activities were measured in cells replated on FN or PLL for 20 min. Data are means; error bars, SD (n = 3). (C) Cells were transfected as indicated with siRNA for PKCα, PKCδ, or PKCɛ, or with luciferase siRNA as a control. Two days after transfection, cells were harvested, and the expression levels of PKCα, PKCδ, PKCɛ, and β1 integrin were analyzed by Western blotting using antibodies directed against each protein. Actin was used as a loading control for Western blotting. The results shown are representative of three independent experiments. (D) Cells were treated as for panel C. PLD activities were measured in cells replated on FN or PLL for 20 min. Data are means; error bars, SD (n = 3). (E) Cells were treated as for panel C. Cells were detached from culture dishes, maintained in suspension for 3 h, and replated on FN for 20 min. (Top) After removal of unbound cells, cells were fixed and stained with TRITC-labeled phalloidin. Bars, 50 μm. (Bottom) Graph showing the quantification of spreading cells. Data are means; error bars, SD (n = 3).

