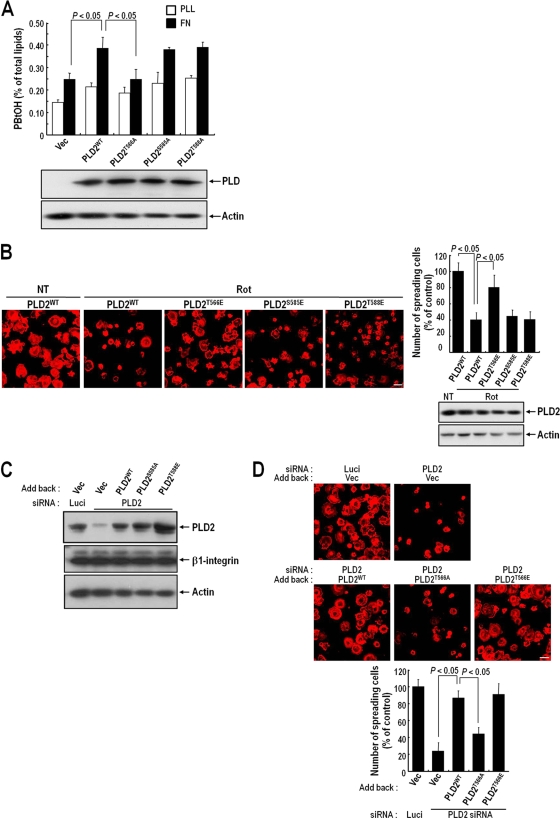
FIG. 5.
PLD2 activation and cell spreading require the PKCδ-mediated phosphorylation of PLD2 at Thr566. (A) COS-7 cells were transfected with either a vector control (Vec), PLD2WT, PLD2T566A, PLD2S585A, or PLD2T588A. PLD activities were measured in cells replated on FN or PLL for 20 min. Data are means; error bars, SD (n = 3). (B) COS-7 cells were transfected with either PLD2WT, PLD2T566E, PLD2S585E, or PLD2T588E. Cells were serum starved for 24 h, detached from culture dishes, maintained in suspension for 3 h, and pretreated with dimethyl sulfoxide or rottlerin (Rot) (10 μM) for 30 min. (Left) Cells were then replated on FN for 20 min, and after unbounded cells were removed, cells were fixed and stained with TRITC-labeled phalloidin. Bars, 50 μm. (Right) Graph showing the quantification of spreading cells. Data are means; error bars, SD (n = 3). (C) COS-7 cells were transfected as indicated with PLD2 siRNA or with luciferase siRNA as a control. After 24 h of siRNA transfection, cells were transfected with either an empty vector, PLD2WT, PLD2T566A, or PLD2T566E, as indicated. They were then harvested, and the expression levels of PLD2 and β1 integrin were quantified by Western blotting using an anti-pan PLD or anti-β1 integrin antibody. Actin was used as a loading control for Western blotting. The results shown are representative of three independent experiments. (D) Cells treated as described for panel C were serum starved for 24 h, detached from culture dishes, maintained in suspension for 3 h, and then replated on FN for 20 min. (Top) After unbounded cells were removed, cells were fixed and stained with TRITC-labeled phalloidin. Bars, 50 μm. (Bottom) Graph showing the numbers of spreading cells. Data are means; error bars, SD (n = 3).

