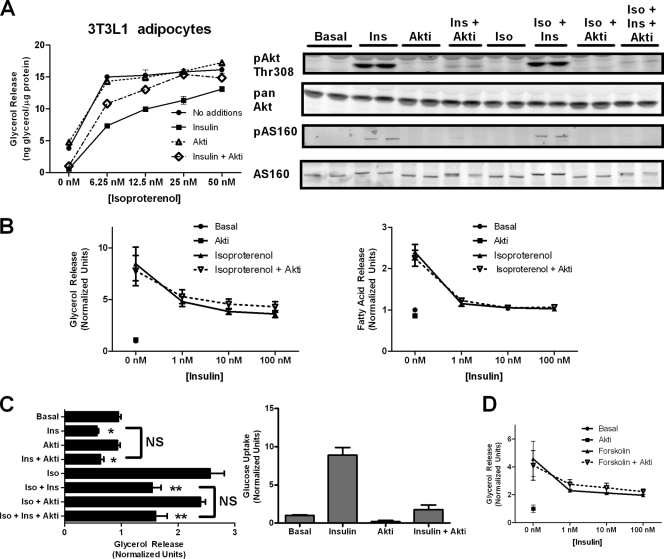
FIG. 2.
Akt inhibition blocks the effect of insulin on glucose transport uptake but not lipolysis. (A) 3T3L1 adipocytes were subjected to a glycerol release assay with increasing doses of isoproterenol in the absence or presence of insulin (1 nM) or Akt inhibitor (5 μM) for 2 h. Data are expressed as means ± standard deviations (SD) from two experiments performed in duplicate. Immunoblots for phospho-Akt Thr308 and phospho-AS160/TBC1D4 using phospho-Akt substrate antibody were performed on cell lysates treated with the indicated conditions, including isoproterenol (2 nM), insulin (25 nM), and Akt inhibitor (20 μM). (B) 3T3-L1 adipocytes were used to generate an insulin dose-response curve of glycerol release (left) and fatty acid release (right) at a low concentration of isoproterenol (2 nM) in the presence and absence of Akt inhibitor (10 μM). Data are expressed as means ± SD from two experiments. (C) Simultaneous glycerol release and glucose uptake assays were performed on cells plated on the same day and cultured side by side with the indicated additions at the following concentrations: isoproterenol (2 nM), insulin (25 nM), and Akt inhibitor (20 μM). Data are expressed as means ± standard errors of the means from three experiments for glycerol release and means ± SD from two experiments for glucose uptake. *, P < 0.05 versus basal levels alone; **, P < 0.05 versus isoproterenol alone; ns, not significant. (D) Glycerol release assay using 1 μM forskolin was performed as described for panel A. Data are expressed as means ± SD from two experiments.

