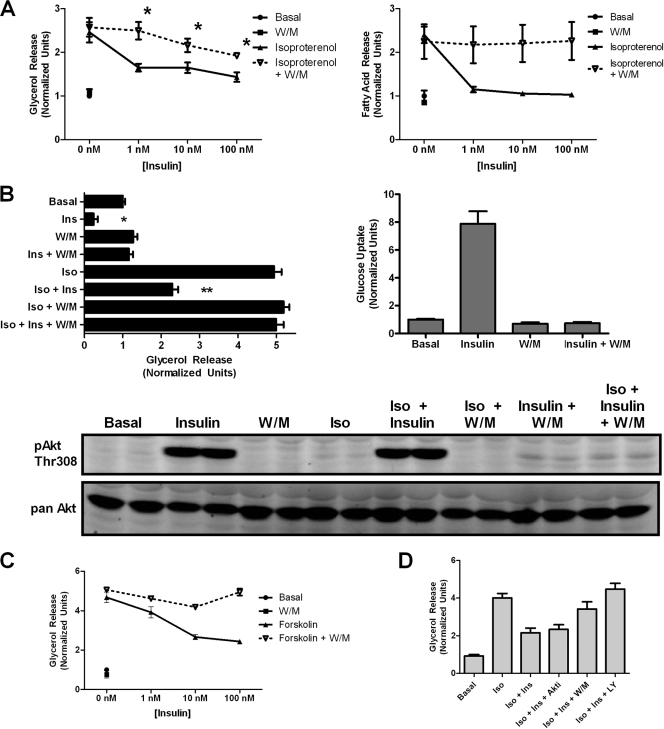
FIG. 3.
PI3K dependence of insulin action on lipolysis and glucose transport. (A) 3T3-L1 adipocytes were serum starved for 2 h and pretreated for 30 min with 100 nM wortmannin (W/M) where indicated. Insulin dose-response curves of glycerol release (left) and fatty acid release (right) were generated in the absence and presence of wortmannin using 2 nM isoproterenol stimulation. Data are expressed as means ± standard errors of the means (SEM) from four experiments for glycerol release and means ± standard deviations (SD) from two experiments for fatty acid release. *, P < 0.05 versus the corresponding point on the isoproterenol-alone graph. (B) Parallel glycerol release and glucose uptake assays were performed on cells plated identically with the indicated additions: isoproterenol (Iso; 2 nM), insulin (Ins; 25 nM), and wortmannin (W/M; 200 nM). Data are expressed as means ± SD from two experiments. Immunoblotting was performed using phospho-Akt Thr308 antibody on cell lysates after a glycerol release assay to confirm the efficacy of wortmannin treatment. (C) Glycerol release assay using 1 μM forskolin stimulation was performed as described for panel A. Data are expressed as means ± SEM from three experiments. (D) Glycerol release assay was performed using the indicated additions: isoproterenol (Iso; 2 nM), insulin (Ins; 25 nM), Akt inhibitor (Akti; 10 μM), wortmannin (W/M; 200 nM), and LY294002 (LY; 25 μM). Data are expressed as means ± SD from two experiments performed in duplicate.

