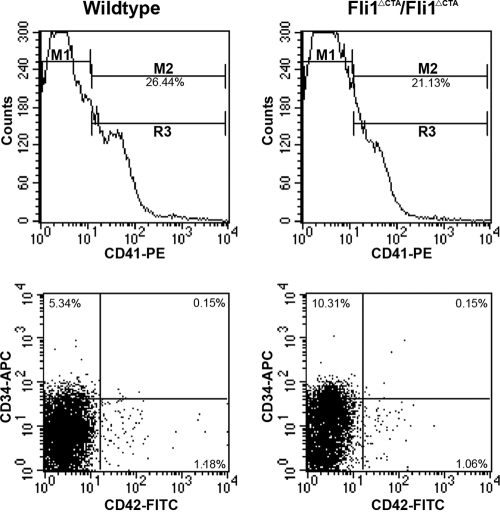
FIG. 2.
Representative flow cytometric analysis of bone marrow megakaryocytic populations from wild-type and Fli1ΔCTA/Fli1ΔCTA mice. Bone marrow samples from wild-type (left panels) or Fli1ΔCTA/Fli1ΔCTA (right panels) mice were analyzed for the total percentage of cells expressing CD41, denoted by M2 (upper panels). Samples were then gated on CD41+ cells (M2) and analyzed for percentages of cells in three subpopulations (lower panels): CD34+/CD42− (upper left quadrant), CD34+/CD42+ (upper right quadrant), and CD34−/CD42+ (lower right quadrant). All samples were analyzed using established gates and uniform quadrant parameters. Percentages in each population for representative wild-type and Fli1ΔCTA/Fli1ΔCTA mice are given in each quadrant.

