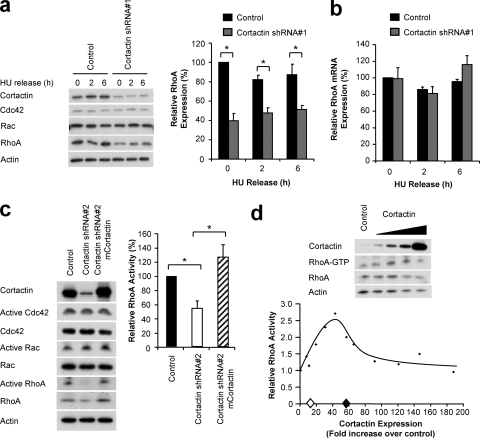
FIG. 8.
RhoA expression and activity are decreased upon cortactin knockdown. (A) Effect of cortactin knockdown on expression of Rho family GTPases. FaDu control and cortactin knockdown cells were synchronized into G1 phase by serum starvation and hydroxyurea (HU) treatment and then released into complete medium for the time periods indicated. The expression of RhoA, Cdc42, and Rac was determined by Western blotting. Protein levels were normalized using actin as a loading control and then expressed relative to the level for control cells at 0 h, which was arbitrarily set at 100%. Data shown represent the mean ± standard error of three independent experiments. *, P < 0.05. (B) Effect of cortactin knockdown on RhoA mRNA levels. mRNA was extracted from FaDu cells treated as described for panel A, and qRT-PCR was performed to determine the relative amounts of RhoA mRNA in each sample, as described in Materials and Methods. Normalized data are expressed relative to the value for control cells at 0 h, which is arbitrarily set at 100%. (C) Effect of cortactin knockdown on Rho family GTPase activation. Synchronized FaDu control, cortactin knockdown, and murine cortactin-reexpressing cells were lysed, and active GTPases were isolated as described in Materials and Methods. The active and total levels of each GTPase were determined by Western blotting. Activity was normalized relative to the level of total protein in each cell type and is expressed relative to the level of activity in control cells, which was arbitrarily set at 100%. Data shown represent the mean ± standard error of at least three independent experiments. *, P < 0.05. (D) Effect of increasing cortactin expression on RhoA activation. GTP-bound RhoA was isolated from cortactin-overexpressing HEK293 cells. Cell lysates were also subjected to Western blotting with the indicated antibodies. RhoA activation and cortactin expression are expressed relative to empty vector-transfected cells, which are assigned an arbitrary value of 1.0. Western blotting is representative of three independent experiments, while the graph contains the individual data points from three experiments due to variations in the cortactin expression obtained between repeat experiments. The comparative levels of cortactin expression in control (⧫) and cortactin knockdown (⋄) FaDu cells are indicated on the x axis.

