
FIG. 2.
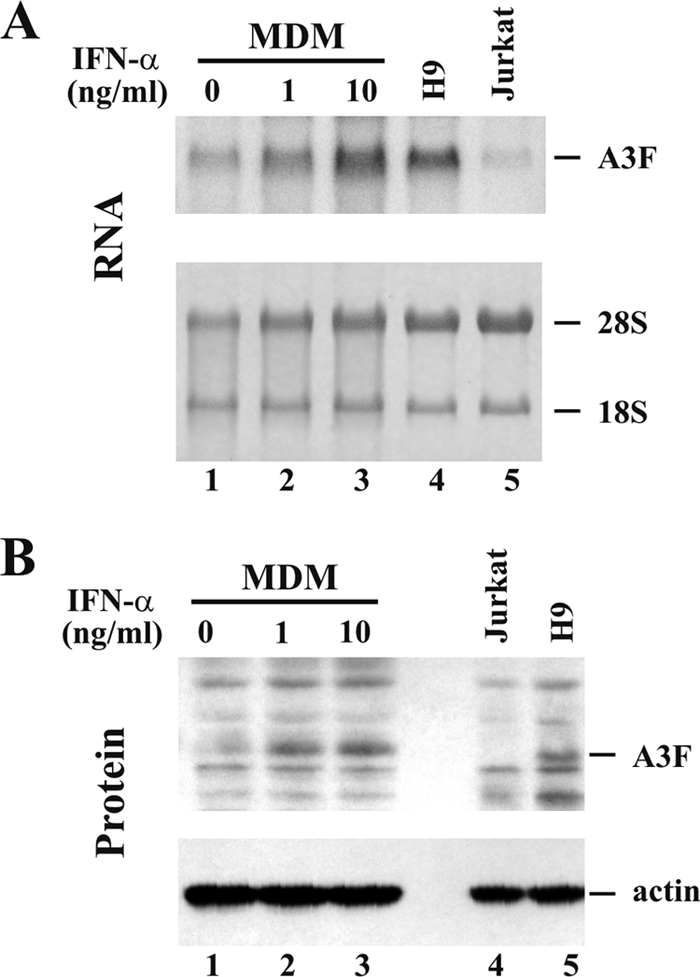
Analysis of endogenous A3F expression in MDM and T-cell lines. (A) Northern blot analysis to determine mRNA expression. MDM were treated for 24 h with IFN-α at 0 ng/ml (lane 1), 1 ng/ml (lane 2), or 10 ng/ml (lane 3). The H9 (lane 4) and Jurkat (lane 5) T-cell lines were analyzed in parallel. Each lane contained 5 μg of total RNA. Samples were separated by denaturing 1% agarose gel electrophoresis and capillary blotted onto a nylon membrane as described in Materials and Methods. The membrane was then probed with an A3F-specific 32P-labeled probe (top). Equal sample loading was verified by staining membranes with methylene blue to identify rRNA species (18S and 28S, bottom). (B) Endogenous expression of A3F protein (top). MDM were treated with IFN-α as for panel A (lanes 1 to 3). The Jurkat (lane 4) and H9 (lane 5) T-cell lines were included for reference. An A3F-specific polyclonal antibody was used for the detection of A3F protein (top). The same blot was stripped and reprobed with an actin-specific antibody (bottom) to control sample loading.