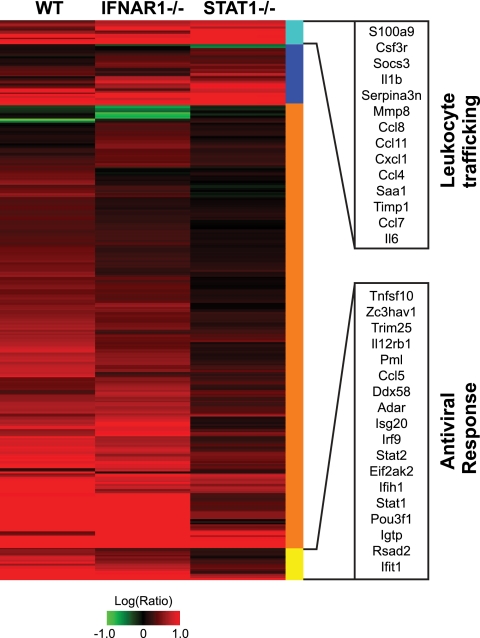
FIG. 5.
Deviant interferon response in STAT1−/− mice. Expression profiles are shown for interferon-stimulated genes (identified by intranasal administration of 10,000 units of interferon alpha for 24 h) (see details in Materials and Methods and reference 14) that were significantly different between STAT1−/− mice and WT or IFNAR1−/− mice as judged by ANOVA. Each column represents gene expression data from an average of 3 animal replicate experiments compared to mock-infected animal results. Genes shown in red were upregulated, genes shown in green were downregulated, and genes shown in black indicate no change in expression relative to mock-infected animal results. Genes are marked according to whether greater differential regulation was observed in STAT1−/− mice (blue and cyan) or in WT and IFNAR1−/− mice (orange and yellow). Genes marked with a cyan bar were functionally annotated as involved with “cell movement of leukocytes” by IPA (14 genes; P = 8.61 × 10⁻¹¹). Genes marked with a yellow bar were functionally annotated as “antiviral response” genes by IPA (18 genes; P = 8.58 × 10⁻¹²). Genes in these functionally annotated categories are listed by Entrez Gene name. Genes comprising this heat map are listed in Table S3 in the supplemental material.

