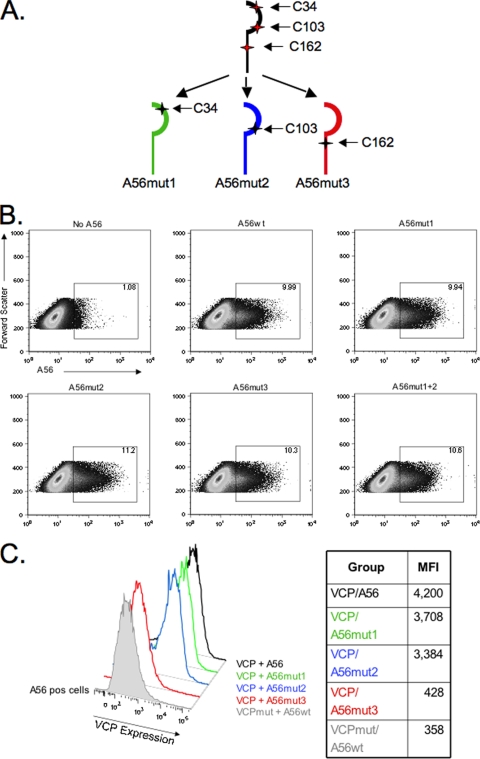
FIG. 2.
A56 mutagenesis and VCP surface expression. (A) Schematic of the cysteine pattern in the ectodomain of A56 and the three cysteine mutant A56 proteins. (B) Expression levels of A56wt versus A56mut1, A56mut2, A56mut3, and A56mut1+2. (C) Cells positive for A56 expression were gated and analyzed for VCP expression. Mean fluorescence intensity (MFI) levels are listed in the table to the right of the figure. VCP was cotransfected with the indicated A56 construct and stained with anti-VCP MAb 3F11, anti-A56 rabbit Ab, and appropriate secondary Abs and analyzed.

