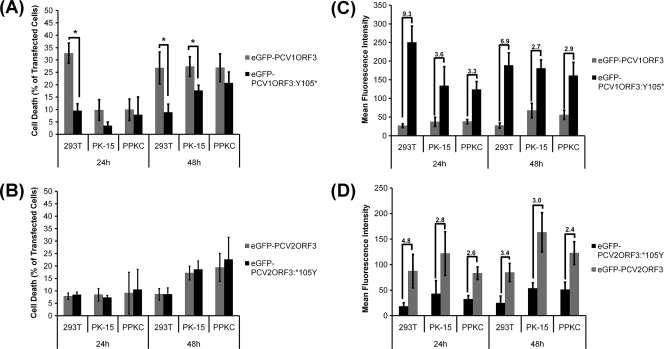
FIG. 6.
Cytotoxicity of mutated PCVORF3 proteins. Error bars represent 95% confidence interval for the standard error of the mean from at least three independent experiments (n ≥ 3). (A and B) Percentage of cell death in transfected cells. Cell death values that are significantly different (P < 0.05) are indicated by brackets and an asterisk. (C and D) Relative protein expression level on a per cell basis as measured by mean fluorescence intensity. The numbers above the bars indicate the average fold differences in mean fluorescence intensities.

