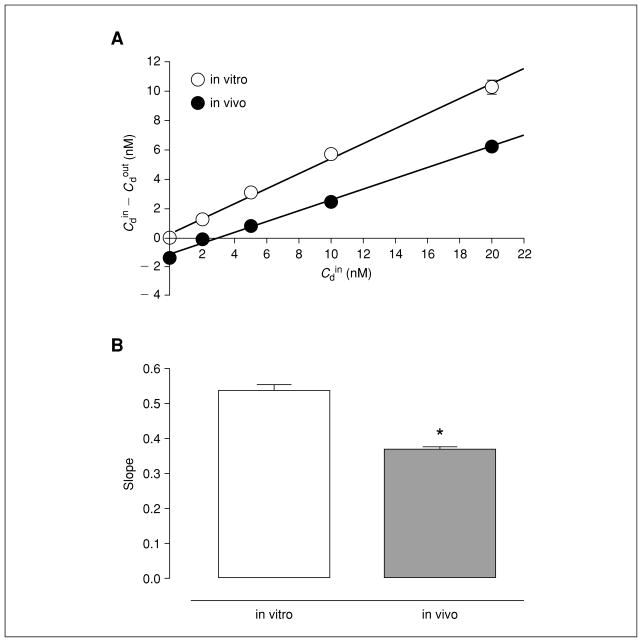
Figure 7.1.2.
No-net-flux microdialysis of DA under well-stirred conditions in vitro at 37°C and in vivo in mouse nucleus accumbens (vehicle-treated controls). (A) Plot of the average gain or loss of DA ( ) to or from perfusate and the average linear regression fit of the data: in vitro (open circles), in vivo (filled circles). The slope of the regression line represents the extraction fraction ( in vitro, Ed in vivo). (B) Bar graph of extraction fraction values expressed as the mean ± S.E.M. (*) Denotes significant difference in between in vitro and in vivo measurements. Reproduced with permission from Chefer et al., 2006.

