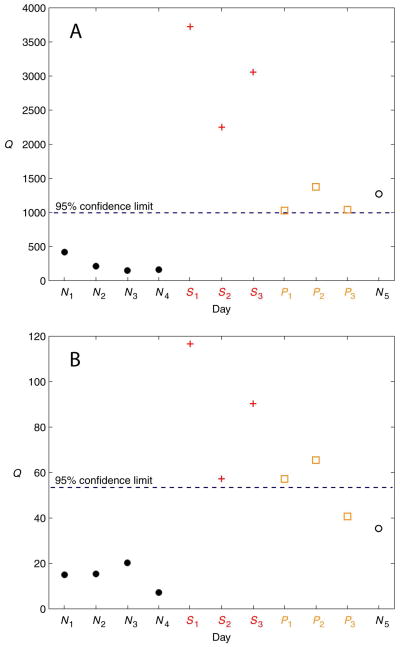
Figure 7.
PCA results for Subject 2 using the Q statistic. (A) Autoscaling. (B) 0-to-1 scaling. The PCA model was developed from the normal training days N1 − N4. All subsequent days are test data. The stress days are denoted by S1 − S3. The post-stress days are denoted by P1 − P3. Post-stress days are not included in the results due to the unknown residual effects of the prednisone during these days. Day N5 is a normal test day.

