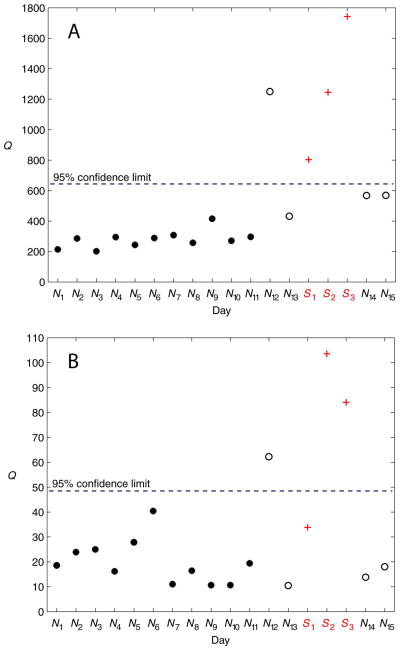
Figure 8.
PCA results for Subject 7 using the Q statistic. (A) Autoscaling. (B) 0-to-1 scaling. The PCA model was developed from the normal training days N1 − N11. All subsequent days are test data. The stress days are denoted by S1 − S3. Days N12 − N15 are normal test days. There were no post-stress days of data collected for this particular subject.

