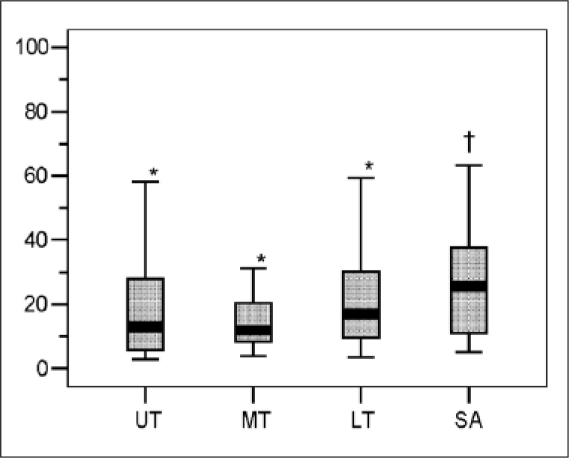
Figure 8.
Box-and-whisker plot showing muscle activity, as expressed as % MVIC, of the upper trapezius (UT), middle trapezius (MT), lower trapezius (LT), and serratus anterior (SA) during scapular depression. The boxes in the plots represent the 25th and 75th percentiles. The line in the box represents the 50th percentile. The whiskers represent the highest and lowest values in the data.

