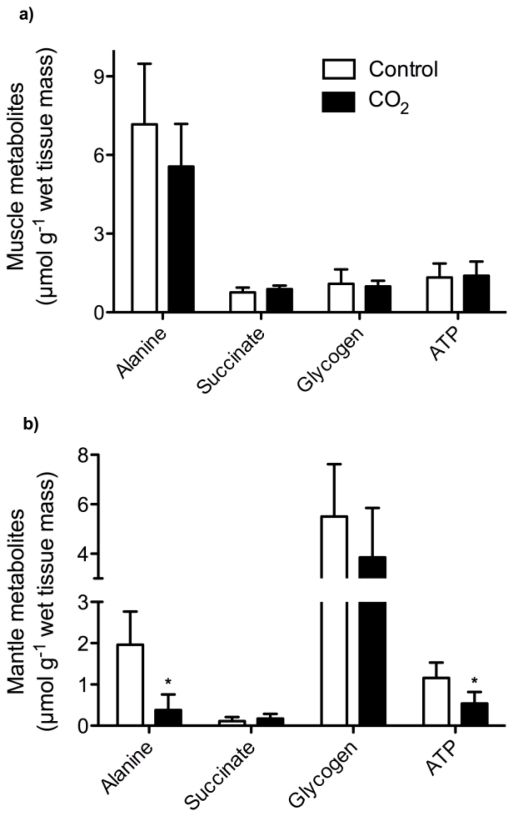
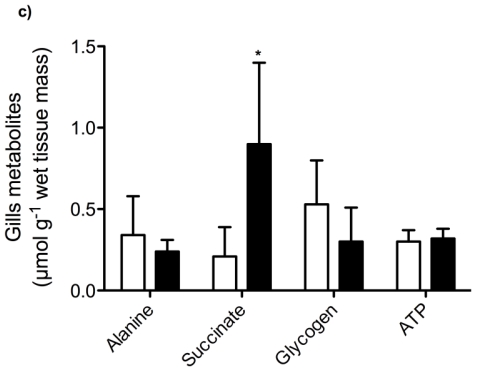
Figure 1.
Levels of tissue metabolites in (a) muscle, (b) mantle and (c) gills of control (normocapnia, seawater Pco2 ~ 0.054 kPa) and CO2-exposed (hypercapnia, seawater Pco2 ~ 0.15 kPa) oysters, C. gigas after long-term incubation at 15 °C.
Data are means ± SD with N = 6–8 (control) and N = 6–9 (CO2-incubation). * indicates significant differences between control and CO2-incubated animals (unpaired t-test, P < 0.05).


