
Figure 2.
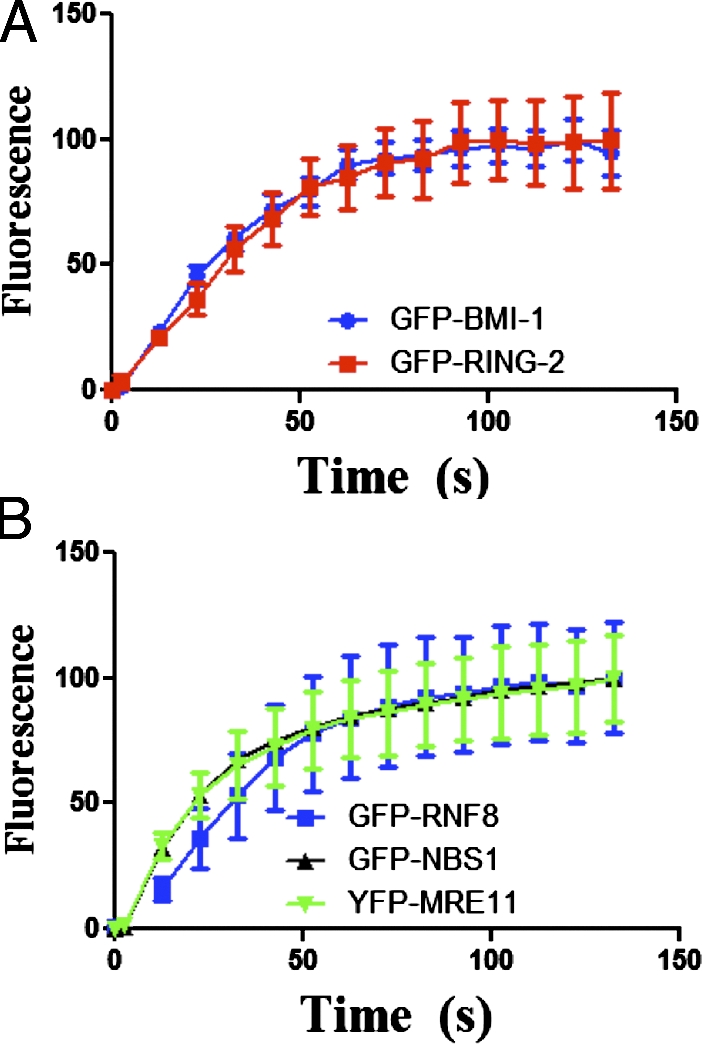
Dynamics of BMI1 and RING2 in living cells. U2OS cells expressing GFP-BMI1 or GFP-RING2 were monitored after microirradiation using time-lapse microscopy. (A) GFP-BMI1 and GFP-RING2 accumulation at laser track sites was quantified. The integrated intensity in the microirradiated areas was determined (n = 15) and the percentage of maximum value was plotted versus time. (B) The recruitment of GFP-tagged DSB repair proteins NBS1, MRE11, RNF8 was quantified for comparison. Error bars represent standard error from two independent experiments.