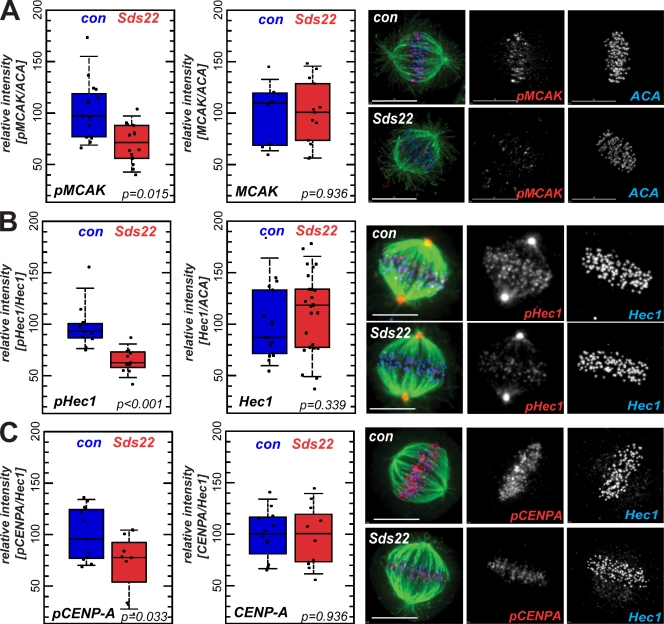
Figure 5.
Effect of Sds22 depletion on substrate phosphorylation and centromere binding of aurora B. (A–C) Representative images and quantification of metaphase cells fixed and stained with anti–phospho-Ser92 MCAK and total MCAK (A), anti–phospho-Hec1 and total Hec1 (B), and anti-phospho–CENP-A and total CENP-A (C) antibodies in fixed HeLa cells 48 h after transfection with control (con) or Sds22-specific duplexes (see Materials and methods). Intensities were normalized relative to general kinetochore markers (Hec1 and ACA as indicated). Box plots and statistical analysis are as in Fig. 3 (E and F). Bars, 10 µm.

