Figure 6.
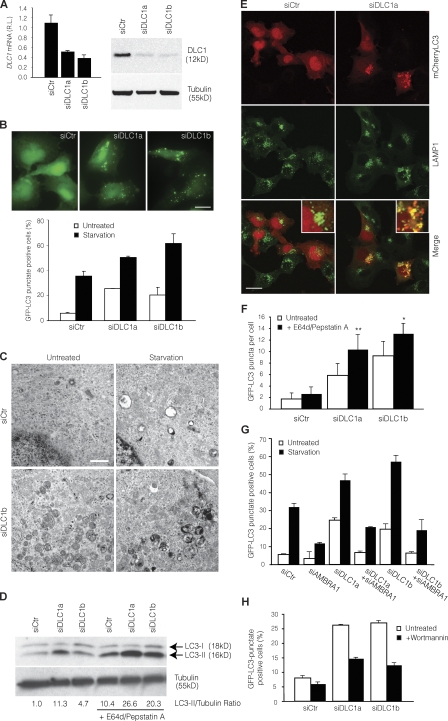
Modulation of autophagy by DLC1 down-regulation. (A) DLC1 down-regulation in GFP-LC3–expressing 2F cells using specific siRNA oligonucleotides (siDLC1a and siDLC1b). DLC1 mRNA and protein levels were analyzed by quantitative PCR (left) and WB (right). siCtr, unrelated oligo; RL, relative levels; tubulin, protein loading control. (B) Increase of basal and starvation-induced autophagy by DLC1 down-regulation. 24 h after transfection with DLC1 siRNA oligonucleotides, GFP-LC3–expressing 2F cells were starved for 4 h or left untreated, and the occurrence of autophagy was analyzed by measuring GFP-LC3 punctate–positive cells. A graph reporting data from three experiments is shown together with representative fluorescence images of siRNA oligonucleotide–transfected cells in control conditions. Bar, 20 µm. (C) Ultrastructural analysis by means of electron microscopy of ultrathin sections from 2F cells transfected with a RNAi oligonucleotides for DLC1 (siDLC1b) or an unrelated oligonucleotide (siCtr) and starved for 4 h or left untreated. Bar, 1.5 µm. (D–F) Increase of autophagosome on rate by DLC1 down-regulation. (D) After DLC1 down-regulation (siDLC1a-b), 2F cells were treated with the lysosome inhibitors E64d and pepstatin A for 4 h or left untreated, and the occurrence of autophagy was analyzed by LC3-I to LC3-II conversion. Densitometric analysis of the band density ratio of LC3-II relative to tubulin is reported with the siCtr ratio arbitrarily defined as 1.00 (Fig. S4 B). (E) mCherryLC3-expressing 2F cells transfected as in D and treated with the lysosome inhibitors E64d and pepstatin A for 4 h were stained by using the lysosome marker LAMP1 (green). Insets containing higher magnification views of the merge images are also shown. Bar, 16 µm. Colocalization was assessed by calculating the Pearson’s correlation coefficient r (mean r: siCtr, 0.24 ± 0.02; siDLC1a, 0.66 ± 0.04). (F) GFP-LC3–expressing 2F cells transfected and treated as in D were analyzed for the appearance of GFP-LC3 puncta per cell. *, P < 0.05; **, P < 0.01. (G) Autophagy induced by DLC1 down-regulation requires AMBRA1. GFP-LC3–expressing 2F cells were transfected using DLC1 and AMBRA1 siRNA oligonucleotides (siAMBRA1) either separately or in combination. 24 h after transfection, 2F cells were starved for 4 h or left untreated, and the occurrence of autophagy was analyzed by measuring GFP-LC3 punctate–positive cells. (H) Autophagy induced by DLC1 down-regulation requires PI3K activity. After DLC1 down-regulation, 2F cells were incubated with Wortmannin for 4 h and analyzed for appearance of GFP-LC3 punctate staining. Error bars indicate mean ± SD of three experiments.

