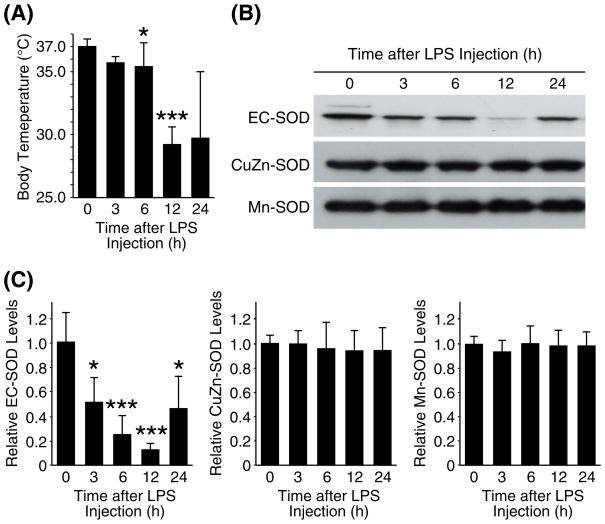
Fig. 3. A time-course of the three SOD levels in the lungs during systemic inflammation.
C57BL/6 mice (2-mo-old, male) were injected with LPS (20mg/kg, i.p.), sacrificed at various time points; lung protein samples were used for Western blot analysis. (A) Body temperature of each mouse at the time of sacrifice. (B) Western blot analyses on pooled protein samples. Each lane represents pooled protein samples from 4 mice. (C) Western blot analyses were also performed on each protein sample from the individual mice, and results of densitometric analysis is shown. Each protein level in the control group (0 h) was set at 1. Statistical significance as compared to the control group is shown with * and *** which indicates p < 0.05 and 0.001, respectively.

