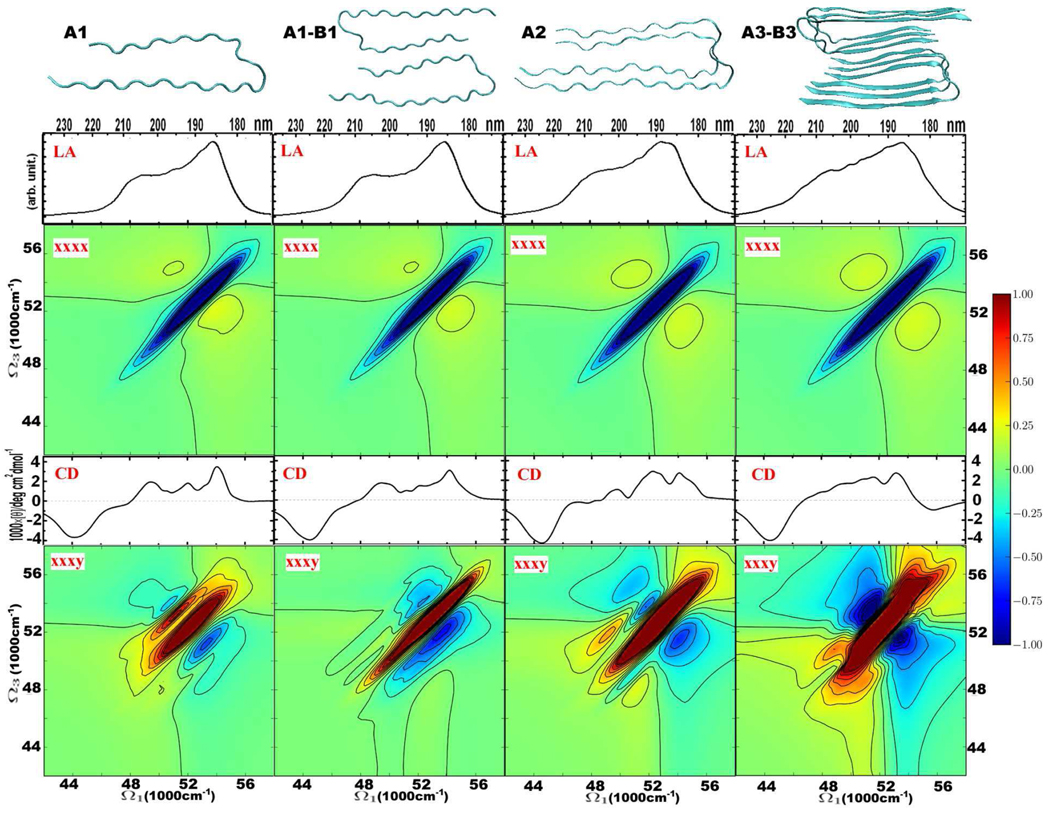
Figure 4.
Variation of CD, LA and 2DUV spectra with the number of structural elements in Aβ9–40 amyloid fibrils. From top to bottom: structures, and absorption, 2DUV xxxx, CD, and 2DUV xxxy spectra. Linear and 2D signals are based on 1000 and 500 MD snapshots, respectively. Red 2DUV signals are positive, and blue 2DUV signals are negative. The 2DUV spectra normalization (R) factors from left to right: for xxxx − 0.38, 0.41, 0.36, 0.33; for xxxy − 0.42, 0.24, 0.18, 0.11.

