
Figure 6.
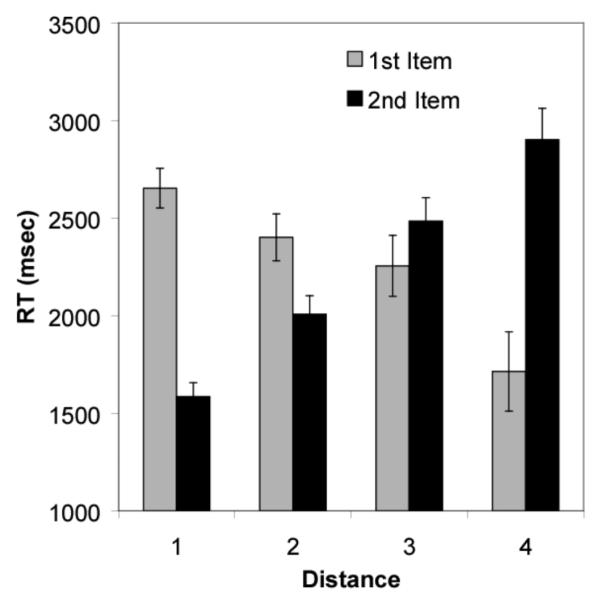
Reaction time to the first and second items in the subset test pair as a function of their distance from one another. It should be noted that the apparent decrease in reaction time to the first item as distance increases is because of the first items being, on average, closer to the beginning of the list (First Item Distance [FID] 1, M = 2652.9, 95% [CI] = ± 198.6; FID 2, M = 2401.7, ± 235.7; FID 3, M = 2255.5, ± 306.6; FID 4, M = 1715.0, ± 399.3; Second Item Distance [SID] 1, M = 1585.7, ± 138.5; SID 2, M = 2007.4.1, ± 186.0; SID 3, M = 2484.6, ± 234.1; SID 4, M = 2901.4, ± 316.2).