Abstract
Automated segmentation of the 3D heart region from non-contrast CT is a pre-requisite for automated quantification of coronary calcium and pericardial fat. We aimed to develop and validate an automated, efficient atlas-based algorithm for segmentation of the heart and pericardium from non-contrast CT.
A co-registered non-contrast CT atlas is first created from multiple manually segmented non-contrast CT data. Non-contrast CT data included in the atlas are co-registered to each other using iterative affine registration, followed by a deformable transformation using the iterative demons algorithm; the final transformation is also applied to the segmented masks. New CT datasets are segmented by first co-registering to an atlas image, and by voxel classification using a weighted decision function applied to all co-registered/pre-segmented atlas images. This automated segmentation method was applied to 12 CT datasets, with a co-registered atlas created from 8 datasets. Algorithm performance was compared to expert manual quantification.
Cardiac region volume quantified by the algorithm (609.0 ± 39.8 cc) and the expert (624.4 ± 38.4 cc) were not significantly different (p=0.1, mean percent difference 3.8 ± 3.0%) and showed excellent correlation (r=0.98, p<0.0001). The algorithm achieved a mean voxel overlap of 0.89 (range 0.86–0.91). The total time was <45 sec on a standard windows computer (100 iterations). Fast robust automated atlas-based segmentation of the heart and pericardium from non-contrast CT is feasible.
Keywords: cardiac segmentation, atlas-based segmentation, co-registration, image registration, non-contrast CT
1. INTRODUCTION
Non-contrast cardiac CT is increasingly used clinically to assess coronary arterial calcium for cardiovascular risk stratification. It is a simple, low-cost, non-invasive scan with low radiation burden. To date, only coronary calcium measurements are routinely made and are reliant on manual computer processing. Pericardial fat, which is emerging as an important parameter for cardiovascular risk stratification1–4, is routinely imaged by non-contrast CT. Currently pericardial fat is not assessed in routine clinical practice, due to the lack of an automated quantification method. For automated quantification of coronary calcium and pericardial fat, a key first step is automated segmentation of the heart and pericardium. In this work, we aimed to develop and validate an automated, efficient atlas-based method for segmentation of the heart and pericardium from non-contrast CT.
Isgum et al have recently described a multiple atlas-based automated method for segmentation of the heart, however, the typical time to achieve the segmentation was about 15 minutes per dataset, which is not feasible for clinical practice5. In this work, we propose an improved fully-automated, efficient atlas-based algorithm for segmentation of the heart and pericardium from non-contrast CT. Our algorithm combines creation of a multiple co-registered segmented atlas and segmentation of CT data by registration to a single atlas dataset, followed by computation of a segmented volume mask using all co-registered atlas datasets. In this work we describe the algorithm and report the initial results.
2. METHODS
2.1. Image data
We retrospectively analyzed non-contrast CT data acquired for routine assessment of coronary calcium, at the Cedars-Sinai Medical Center. The data was acquired on an Electron Beam CT scanner (e-speed, GE Imatron) or a 4-slice Multislice CT scanner (Volumezoom, Siemens) using standard prospectively-gated imaging protocol for coronary calcium scoring, as described in6. Each CT dataset consisted of 50 to 60 slices with 512×512 matrix size, pixel size of 0.68×0.68 mm2, and slice thickness of 2.5–3 mm. The datasets were selected from consecutive, asymptomatic patients undergoing coronary calcium screening by an experienced observer, and were free of any motion artifacts as assessed visually.
2.2 Algorithm
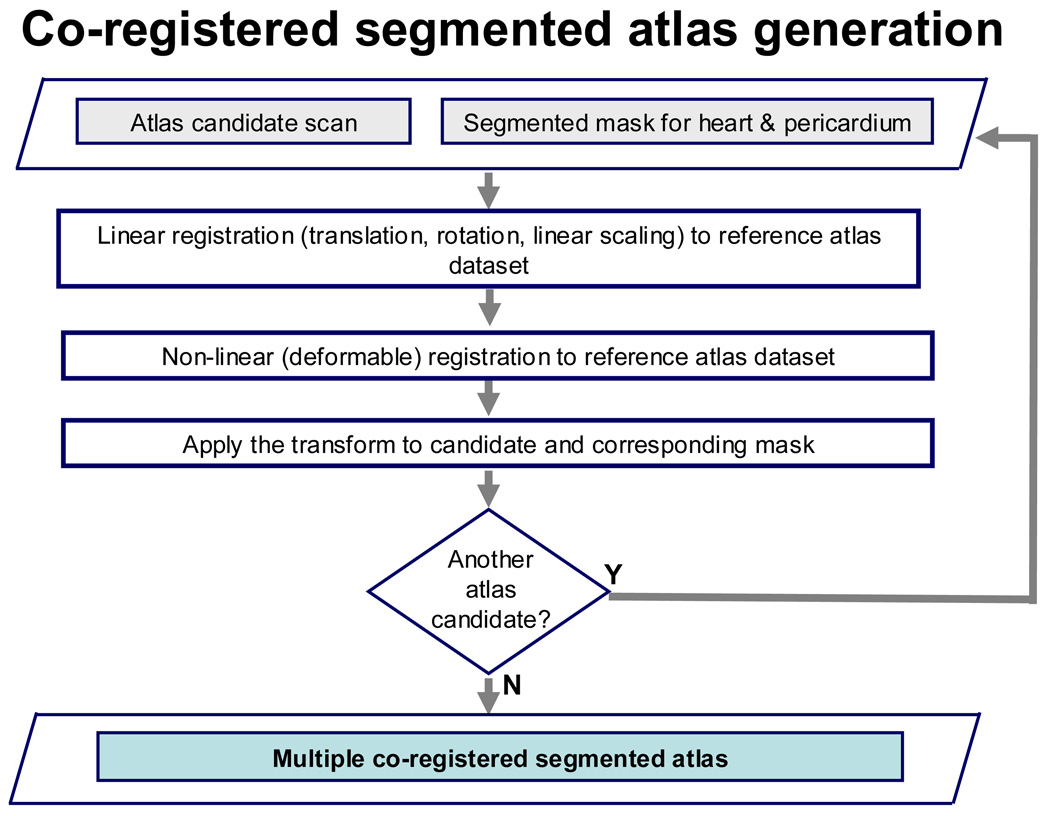
Figure 1 (a) and (b) summarize the key steps of the algorithm. A non-contrast CT atlas was first created from multiple co-registered non-contrast CT data (N=8), for which the whole heart (cardiac region and pericardium) were manually segmented (Figure 1 (a)). To manually segment each dataset, the superior and inferior limits of the heart were first manually marked. Manual 2D contours were then traced within these limits by an expert physician along the pericardium (including the heart) on all transverse slices. A 3D binary volume mask was generated from the 2D contours. The time to perform manual segmentation for each dataset was approximately 30–40 minutes.
Figure 1.
(a). Flowchart showing atlas creation.
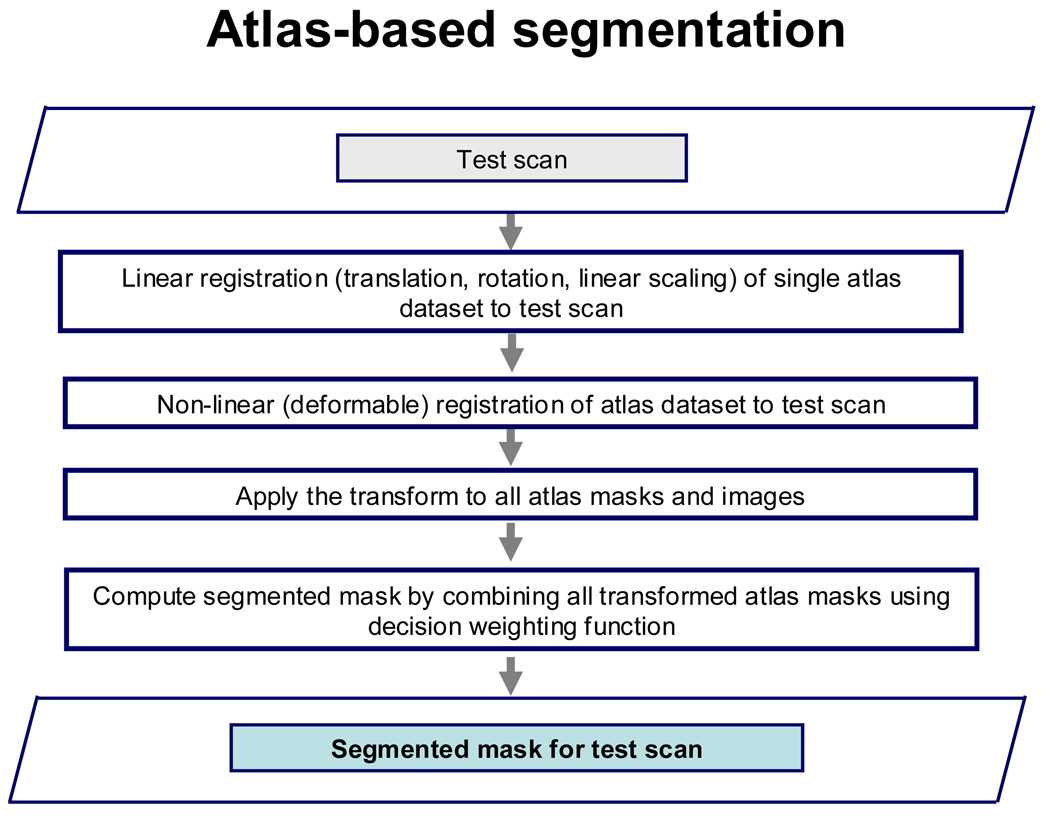
(b). Flowchart showing atlas-based segmentation.
Non-contrast CT data included in the atlas were co-registered to a single reference atlas image using an iterative, multi-resolution linear registration method (with translation, rotation and linear scaling) with sum of squared differences as the cost function. For each iteration, 9 parameters (translation in x,y,z, rotation about the x, y, z axes and linear scaling in x, y, z directions) were adjusted. The linear registration was followed by a non-rigid transformation using deformation fields computed by the iterative demons algorithm7. The final transformations were also applied to the respective binary volume masks, which are included in the atlas. Therefore, all atlas datasets and their corresponding masks were in the same spatial co-ordinates (Figure 1(a)).
Figure 1(b) illustrates the atlas-based segmentation method for test CT datasets. First, a single atlas dataset was co-registered to the test CT dataset, using an iterative linear registration technique, followed by a non-rigid transformation by the iterative demons algorithm7, as for the atlas cases. The transformation was applied to all atlas masks and images and the segmented volume mask for the new dataset was then computed by combining all the atlas volume masks using a weighted decision scheme similar to the one proposed by Isgum et al5. The volume mask is then refined by applying neighborhood-based filtering to eliminate noise and an iterative hole-filling algorithm to close voxels inside the pericardium. The algorithm was implemented in C++ using components from the ITK library.
2.3 Algorithm performance
Our automated segmentation method was applied to 12 test CT datasets, with a non-contrast CT atlas created from 8 datasets. To compare algorithm performance with expert manual quantification, an expert observer manually traced the cardiac region (heart and pericardium) for all 12 test CT datasets, similar to the manual segmentation of the atlas. Cardiac region volume was calculated from the manual tracings and compared to that derived from the automated algorithm. Pearson’s correlation, Bland-Altman comparison and the paired t-test were used to compare the cardiac region volume derived by the algorithm to expert manual quantification. Volume overlap was also measured by the Dice similarity coefficient (DC), as follows:
where A and M define the set of voxels in the regions segmented by the automated method and the expert-manual method, respectively. A value of DC equal to 1.0 would therefore indicate complete agreement.
3. RESULTS
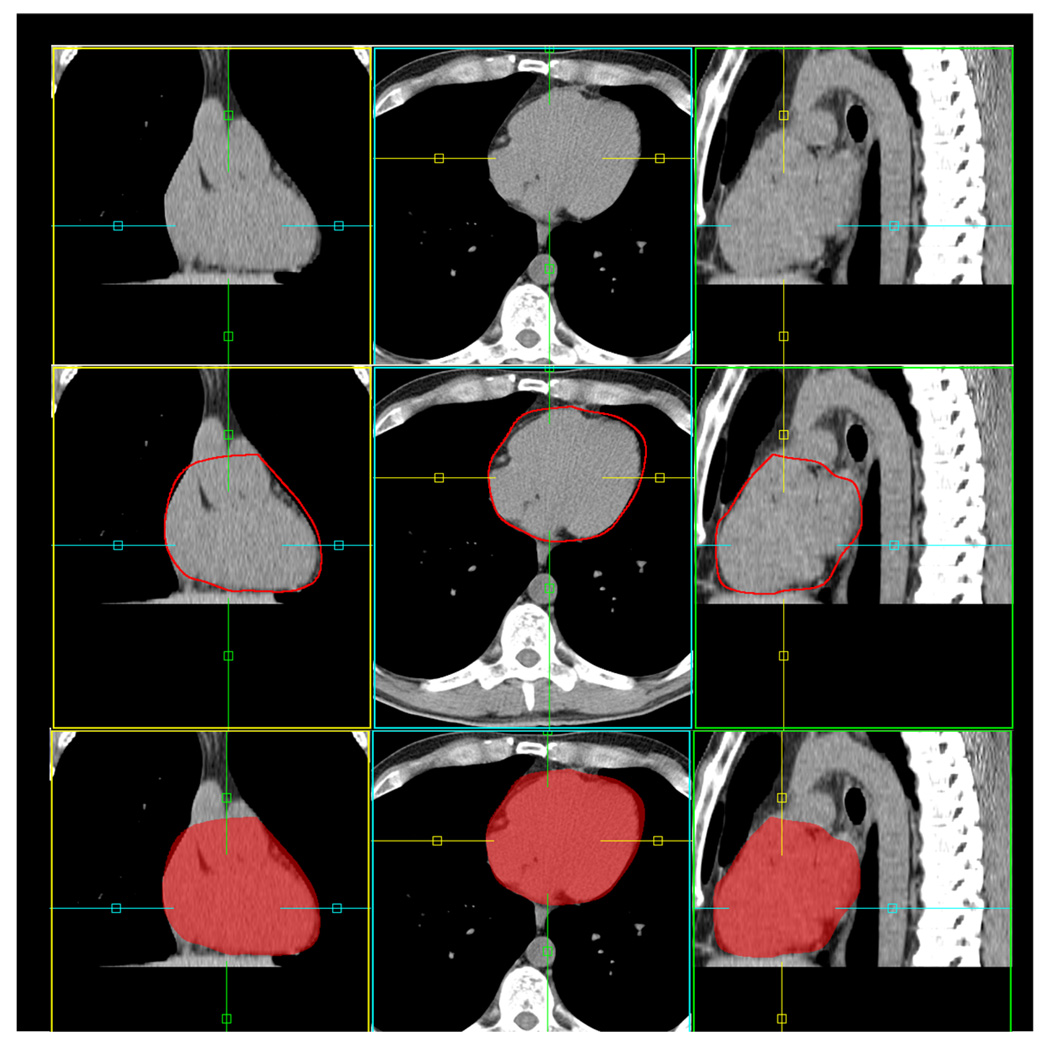
Figure 2 shows an example of the results of the automated algorithm. The number of iterations was set to 100 (for both linear and non-linear registration). Cardiac region volume for the 12 test datasets was 609.0 ± 39.8 cc by the automated algorithm and 624.4 ± 38.4 cc from expert manual quantification, and was not significantly different (p=0.1, NS). The mean percent difference between the algorithm and the expert for cardiac region volume was 3.8 ± 3.0%.
Figure 2.
Example of automated atlas-based segmentation. The segmented cardiac region (including heart and pericardium) is shown with red contour (middle) and semi-transparent red overlay (bottom).
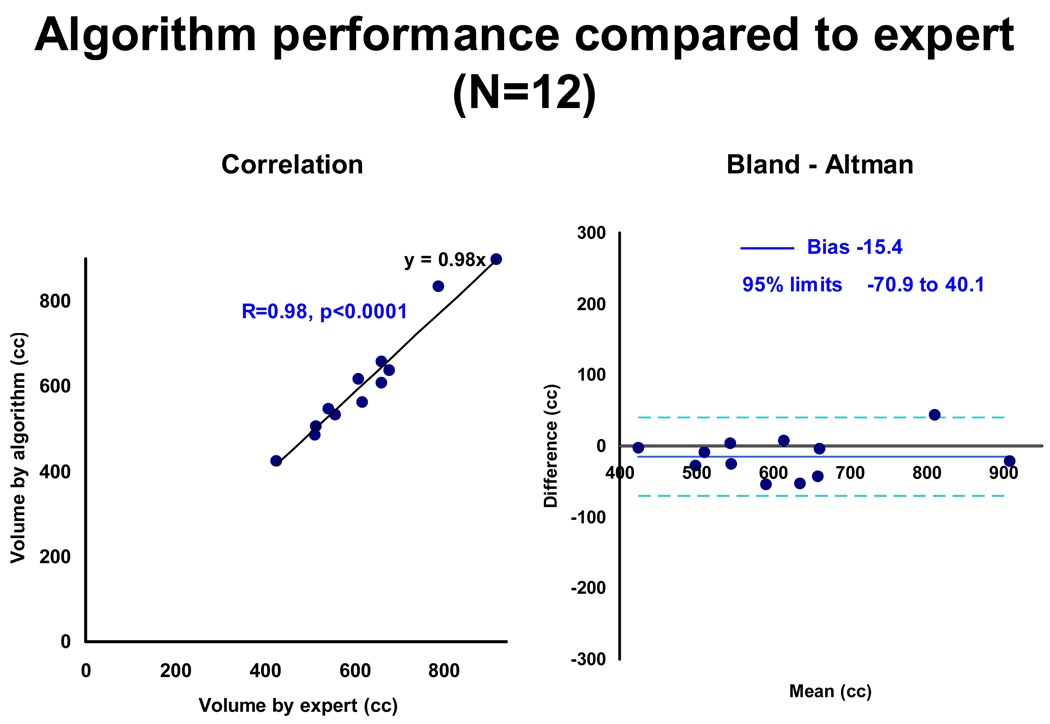
Figure 3 shows the algorithm performance compared to expert manual quantification. There was excellent correlation between the algorithm and the expert for cardiac region volume (R=0.98, p<0.0001). The Bland-Altman plot shows a negative bias of −15.4 cc for cardiac region volume. The 95% limits of agreement ranged from −70.9 to 40.1 cc, with 11 out of the 12 test cases within the limits of twice the standard deviation, indicated by dotted blue lines. The mean Dice Coefficient was 0.89 ± 0.01 over the cardiac range (range 0.86–0.91) and 0.94 ± 0.01 (range 0.92–0.95) over the central 70% of the heart. For 100 iterations, mean run time was 39 ± 7.4 seconds on a standard windows workstation (2.5 GHz computer with 3.5 GHz memory).
Figure 3.
Algorithm performance compared to expert (N=12).
Our initial results are promising for the automated algorithm at 100 iterations. We also investigated the algorithm performance with the number of iterations of the algorithm. Table 1 shows mean run times, Dice Coefficient values and cardiac region volume %difference from expert manual quantification, for all 12 CT datasets for 20, 50 and 100 iterations. Cardiac region volumes for both 50 and 100 iterations were not significantly different from expert manual quantification. The best overall algorithm performance, however, was for 100 iterations. Run times were typically <15 sec for 20 iterations, <30 sec for 50 iterations and <45 sec for 100 iterations. For a typical dataset, non-linear registration took approximately 22% of the total run time.
Table 1.
Algorithm performance for 20, 50 and 100 iterations. Cardiac region volume for 50 and 100 iterations were not significantly different from expert manual quantification.
| Iterations | Time (sec) | Overlap (Dice Coefficient) |
Cardiac region volume difference (%) from expert |
Overlap central 70% cardiac region (Dice coefficient) |
|---|---|---|---|---|
| 20 | 12.8 ± 2.1 | 0.80 ± 0.10 | 13.7 ± 11.7 (p=0.04*) | 0.87 ± 0.09 |
| 50 | 23.1 ± 3.7 | 0.86 ± 0.05 | 6.7 ± 5.2 (p=0.7, NS) | 0.92 ± 0.03 |
| 100 | 39.0 ± 7.4 | 0.89 ± 0.01 | 3.8 ± 3.0 (p=0.1, NS)) | 0.94 ± 0.01 |
4. DISCUSSION
Several novel steps were implemented in our algorithm to ensure fast robust performance. These included the creation of multiple co-registered segmented non-contrast CT atlas, and the requirement that a single atlas dataset needed to be co-registered to a given CT dataset, followed by segmentation by combining the atlas masks from all co-registered atlas datasets, and an efficient non-linear registration algorithm. Our approach differs from the method described by Isgum et al; in their study, all the atlas datasets were separately co-registered to a given CT dataset, using affine and b-spline-based non-linear registration, and registration times were approximately 15 minutes per dataset5.
Potential applications of this method would include automated coronary calcium scoring and automated quantification of pericardial fat. Recently, Dey et al have described a semi-automated, knowledge-based algorithm for defining a 3D bounding-box enclosing the heart and quantification of fat within this region (thoracic fat) using preset fat attenuation thresholds6. Bandekar et al also proposed a semi-automated method for quantification of thoracic fat8. To our knowledge, however, no efficient automated algorithms for defining the heart and pericardium from non-contrast CT have yet been reported. Manual tracing is time-consuming and subject to inter-observer variability3, 4.
Future work: Our results show improved volume overlap in the central 70% of the volume compared to the entire heart (Table 1); knowledge-based constraints to define the superior and inferior cardiac limits may improve the segmentation results. We are also currently investigating optimal selection of the reference atlas dataset, by measurement with automated similarity metrics; and group wise selection by matching gender and BMI. This method is potentially applicable to other 3D imaging methods, such as contrast-enhanced coronary CT angiography and 3D Magnetic Resonance Imaging sequences.
5. CONCLUSIONS
Fast automated atlas-based 3D segmentation of the heart and pericardium from non-contrast CT is feasible and shows excellent agreement with expert manual quantification.
ACKNOWLEDGEMENTS
This research was supported in part by NIH grant# 1R21EB006829-01A2 (PI: Damini Dey) and in part by the Glazer and Lincy Foundation, Los Angeles, CA. The content is solely the responsibility of the authors and does not represent the official views of NIBIB or NIH.
REFERENCES
- 1.Rosito GA, Massaro JM, Hoffmann U, Ruberg FL, Mahabadi AA, Vasan RS, O'Donnell CJ, Fox CS. Pericardial Fat, Visceral Abdominal Fat, Cardiovascular Disease Risk Factors, and Vascular Calcification in a Community-Based Sample: The Framingham Heart Study. Circulation. 2008 February 5;117(5):605–613. doi: 10.1161/CIRCULATIONAHA.107.743062. 2008. [DOI] [PubMed] [Google Scholar]
- 2.Mahabadi AA, Massaro JM, Rosito GA, Levy D, Murabito JM, Wolf PA, O'Donnell CJ, Fox CS, Hoffmann U. Association of pericardial fat, intrathoracic fat, and visceral abdominal fat with cardiovascular disease burden: the Framingham Heart Study. European Heart Journal. 2009 January 9; doi: 10.1093/eurheartj/ehn573. 2009; in press. [DOI] [PMC free article] [PubMed] [Google Scholar]
- 3.Dey D, Wong ND, Tamarappoo BK, Nakazato R, Gransar HG, Cheng VY, Ramesh A, Kakadiaris I, Germano G, Slomka PJ, Berman DS. Computer-aided Non-contrast CT-based Quantification of Pericardial and Thoracic Fat and Their Associations with Coronary Calcium and Metabolic Syndrome. Atherosclerosis. 2009 doi: 10.1016/j.atherosclerosis.2009.08.032. in press. [DOI] [PMC free article] [PubMed] [Google Scholar]
- 4.Greif M, Becker A, von Ziegler F, Lebherz C, Lehrke M, Brödl U, Tittus J, Parhofer K, Becker C, Reiser M, Knez A, Leber AW. Pericardial Adipose Tissue Determined by Dual Source CT Is a Risk Factor for Coronary Atherosclerosis. Arterioscler Thromb Vasc Biol. 2009;29:781–786. doi: 10.1161/ATVBAHA.108.180653. [DOI] [PubMed] [Google Scholar]
- 5.Isgum I, Staring M, Rutten A, Prokop M, Viergiver MA, van Ginneken B. Multi-Atlas-Based Segmentation With Local Decision Fusion - Application to Cardiac and Aortic Segmentation in CT Scans. IEEE Trans Med Imag. 2009 doi: 10.1109/TMI.2008.2011480. in press. [DOI] [PubMed] [Google Scholar]
- 6.Dey D, Suzuki Y, Suzuki S, Ohba M, Slomka PJ, Polk D, Shaw LJ, Berman DS. Automated Quantitation of Pericardiac Fat From Noncontrast CT. Invest Radiol. 2008 Feb;43(2):145–153. doi: 10.1097/RLI.0b013e31815a054a. [DOI] [PubMed] [Google Scholar]
- 7.Thirion JP. Image matching as a diffusion process: an analogy with Maxwell's demons. Medical Image Analysis. 1998;2(3):243–260. doi: 10.1016/s1361-8415(98)80022-4. [DOI] [PubMed] [Google Scholar]
- 8.Bandekar A, Naghavi M, Kakadiaris IA. Automated Pericardial Fat Quantification in CT Data; Proc. of the 28th Annual Intl. Conf. of the IEEE Engineering in Medicine and Biology Society, (EMBS'06), New York, Aug 30 – Sep 3; 2006. [DOI] [PubMed] [Google Scholar]


