
Figure 1. TMS coil position and experimental paradigm.
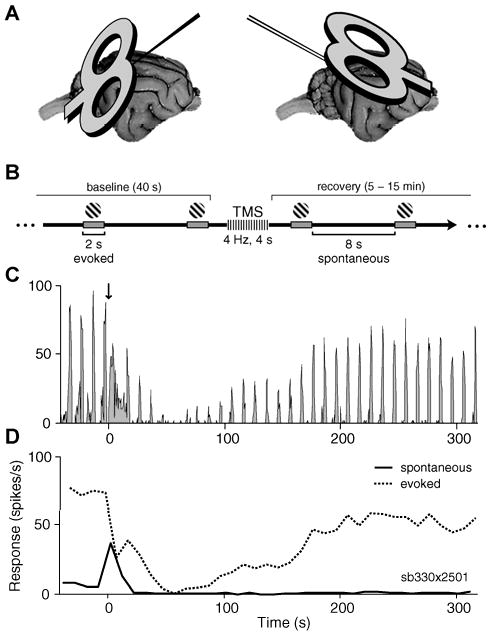
A) Illustration of the two coil-electrode configurations. At 28 sites in 3 cats, the coil was positioned posterior to the visual cortex and angled towards the horizontal plane (left). Penetrations were made with a carbon fiber electrode at an angle of P45, M0. At 19 recording sites in 2 cats, the coil was positioned obliquely near the transverse plane, superior to the visual cortex (right). Penetrations were made with a dual tungsten array (inter-electrode spacing of ∼400 μm) at an angle of A45, M0. For both configurations, the midpoint of the coil was centered on the primary visual cortex craniotomy and was located between 1 and 2 cm from the skull. No significant differences between the neural responses to TMS were found for the different electrode-coil configurations (rank sum test, p > 0.2), thus these data were pooled in all analyses. B) Timeline of a single trial. A visual stimulus (high contrast drifting grating) was presented repeatedly for 2 s with an inter-stimulus interval of 8 s. After a baseline period (40 s), a short TMS pulse train (1– 4 s, 2 – 8 Hz, 100% stimulator intensity) was applied during an inter-stimulus interval. Single-unit and LFP data were collected during response recovery (typically 5-15 min). C) Peri-stimulus time histogram (PSTH) of spiking activity during a sample trial. Downward arrow at time zero denotes the application of a 4 Hz, 2s TMS pulse train. In this and all subsequent PSTHs the bin size is 0.5 s. D) Firing rate for the same trial as shown in (C), with activity separated into spontaneous and evoked components. The evoked response (dotted line) represents average activity during stimulus presentations, while the spontaneous component (solid line) indicates activity that occurred between stimuli.