
Figure 2. Examples of variability in TMS responses.
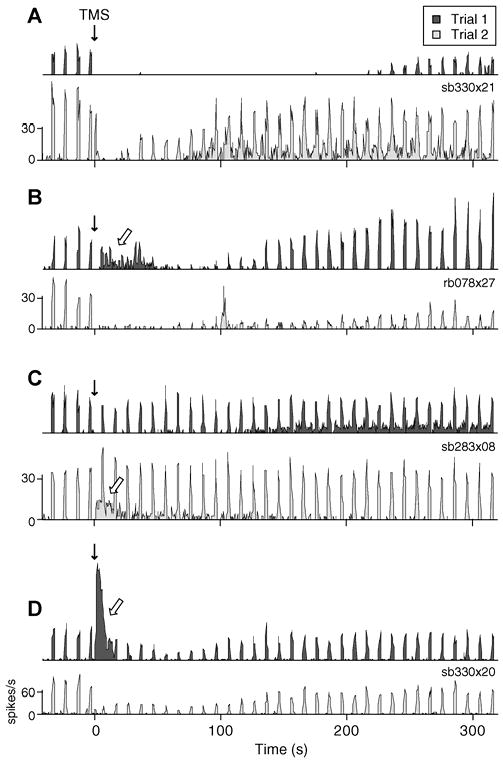
A-D) PSTHs of two sample trials with identical TMS parameters for 4 different cells. Downward solid arrows denote application of the TMS pulse train. Open arrows signify substantial spontaneous discharge following TMS. The stimulation parameters used in each example are as follows: (A) 4 Hz, 2s; (B) 8 Hz, 4 s; (C) 4 Hz, 4 s; and (D) 4 Hz, 2 s. Evoked response components within single cells are more similar than those between cells. For example, some neurons reliably show moderate (D) or strong (B) reduction of evoked spiking following a TMS pulse train, while others consistently exhibit little alteration in stimulus evoked activity (C). In contrast, spontaneous responses are extremely variable across identical trials within the same cell. In many instances (B-D), neurons display substantial spontaneous discharge on one trial, but a complete absence of spontaneous firing on another.