
Figure 3. Trend in spontaneous response to TMS over time.
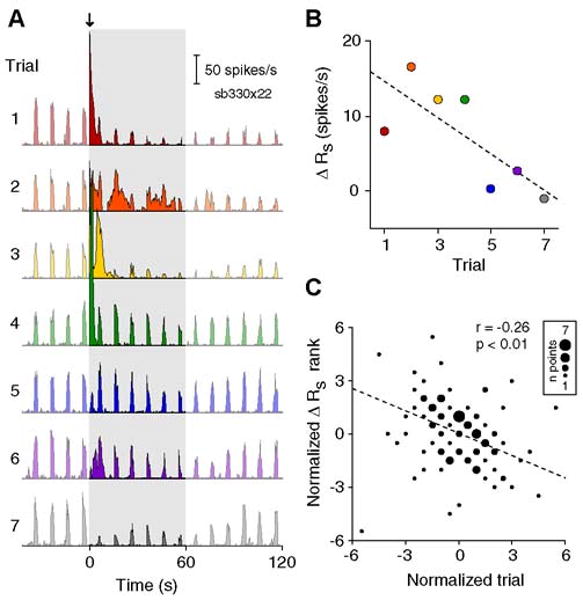
A) PSTHs of 7 consecutive trials from a single cell. A 4 Hz, 2s TMS pulse train (downward arrow) was applied in each trial. PSTHs are truncated at 2 minutes to highlight spontaneous activity in the first 60 seconds following TMS (shaded area). Colors in panels (A) and (B) represent trial number. B) Scatterplot of trial number versus the change in spontaneous firing rate (ΔRs) for the set of trials shown in (A). ΔRs is calculated as the difference between the average spike rate in the first minute following TMS and the average value during the baseline period. Dashed line indicates the least-squares fit to the data. C) Scatterplot of normalized trial number versus normalized ΔRs for 23 sets of data (n = 112 total trials). For each set of data, the values for ΔRs and trial number were transformed into their respective ranks then normalized by subtracting the mean rank. Symbols of different sizes are used to indicate the number of the trials at the same rank coordinates. Trial number and the spontaneous response exhibit a weak negative correlation (r = -0.26, p <0.01, t test). No relationship is found between trial number and the evoked response (r = 0.07, p = 0.46, t test).