
Figure 6. Influence of baseline variables on responses to TMS.
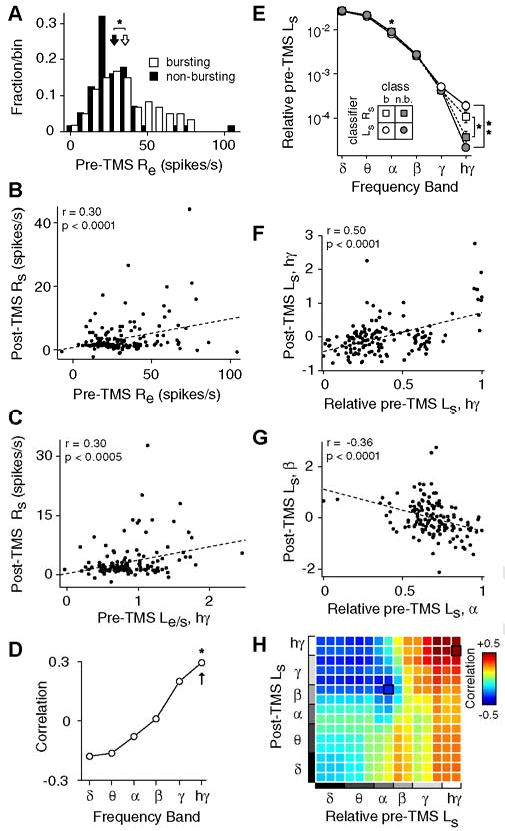
(A) Distribution of stimulus-evoked responses (Re) during the baseline period for B (open, n = 60) and NB (filled, n = 56) trials. The average Re of B trials (mean ± std: 35 ± 19 spikes/s, open arrow) is slightly greater than that of the NB trials (28 ± 17 spikes/s, filled arrow), leading to a significant difference between the distributions (p<0.05, rank-sum test). B) Scatterplot of baseline evoked activity (Re) and post-TMS spontaneous activity (Rs) for all trials (n = 161). Pre-TMS evoked activity and post-TMS spontaneous activity are significantly correlated (r = 0.30, p<0.0001, t test). In this and subsequent panels, ‘post-TMS’ variables are defined as the average value over the first minute following TMS (i.e., interval I). In addition, displayed correlations cannot be explained by differences in pre-TMS spontaneous activity, TMS stimulation parameters, or trial number, as factors potentially contributing explanatory power have been linearly regressed from both variables using partial correlation (see Methods). C) Scatterplot of pre-TMS evoked LFP high gamma power relative to spontaneous power (Le/s, hγ; see Methods) and post-TMS spontaneous spiking (Rs) for trials with single-unit and LFP data (n = 138). D) Pearson correlation coefficients between baseline Le/s and post-TMS spontaneous spiking for all LFP frequency bands. Asterisk indicates a significant correlation (p<0.05, t test, corrected). Arrow denotes the coefficient for the data displayed in panel (C). E) Power of baseline spontaneous LFPs as a function of trial type. Here, the LFP power in each band is relative to the total spectral power (see Methods). Trials were classified as B or NB both by spiking activity (squares) and LFP power (circles). Single and double asterisks denote a significant difference between groups at p < 0.05 and p < 0.0005 criteria, respectively (rank-sum test, corrected). F,G) Scatterplots of the relative baseline spontaneous LFP power and the post-TMS spontaneous LFP power (n = 142 trials). A significant positive correlation is found between baseline high gamma power and post-TMS high gamma power (F). A significant negative correlation is found between baseline alpha power and post-TMS beta power (G). H) Correlation coefficients between the relative pre-TMS spontaneous power and the post-TMS spontaneous power for all frequency band combinations. To improve resolution beyond the six traditional bands (i.e., delta through high gamma), we divided the full frequency range (1 to 150 Hz) into 15 logarithmically-spaced bins. The (ij)th element in the matrix corresponds to the correlation coefficient between the relative Pre-TMS power in the ith frequency bin, and the post-TMS Ls in the jth frequency bin. Elements outlined in black correspond to the data displayed in panels (F) and (G).