
Figure 7. Correlations between TMS responses on different electrodes.
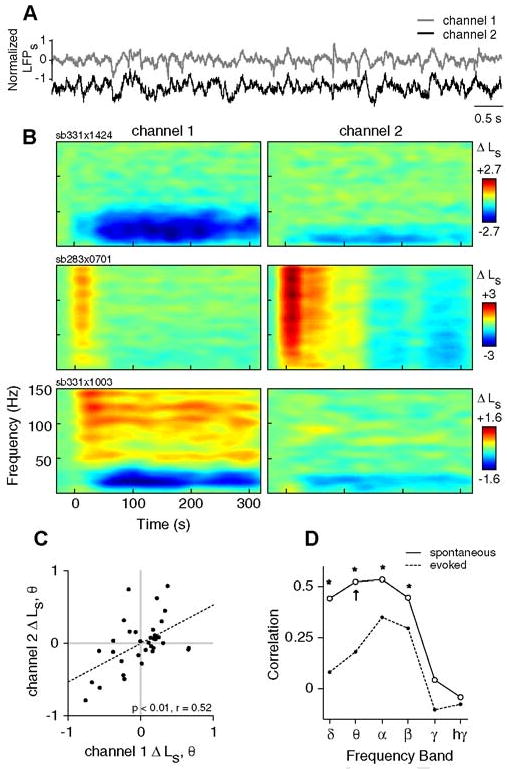
A) Sample trace showing 8 s of spontaneous LFPs recorded from two different electrodes placed approximately 400 μm apart in area 17. Channel 1 denotes the electrode at which single-unit activity is isolated. B) Example spectrograms from 3 different TMS trials showing changes in spontaneous LFP power (ΔLs) on channel 1 (left) and channel 2 (right). The TMS parameters used in each trial are as follows: sb331×1424, 8 Hz, 4 s; sb283×0701, 4 Hz, 4 s; and sb331×1003, 8 Hz, 4 s. C) The changes in spontaneous theta band power (ΔLs, θ) on channels 1 and 2 are significantly correlated (n = 34, p< 0.0001, t test). Here, ΔLs, θ is calculated as the change in theta band power between the first minute post-TMS (interval I) and the pre-TMS baseline period. D) Pearson correlation coefficients for Δ Ls between channels 1 and 2 over all frequency bands. Asterisks indicate significant correlations (p< 0.05, t test, corrected). Arrow denotes the correlation coefficient for the data shown in panel (C). Note that possible confounds of these correlations (i.e., stimulation parameters and trial number) have been removed through partial correlation (see Methods).