
Figure 8. Effect of TMS on spatial coherence.
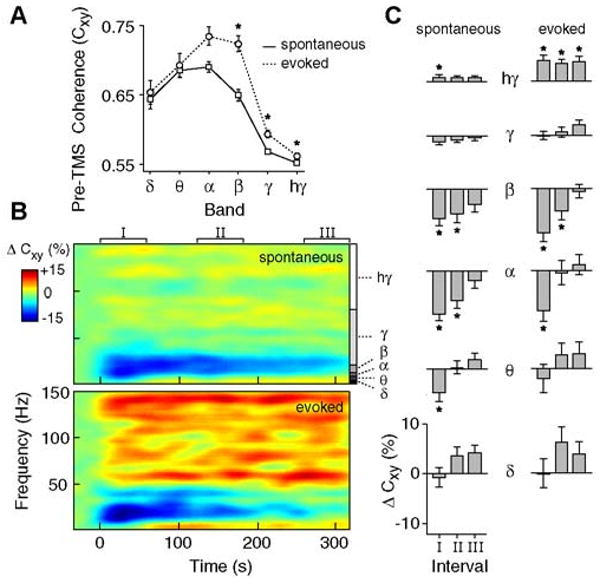
A) Average levels of inter-electrode LFP coherence (Cxy) during the pre-TMS baseline period for spontaneous (solid) and evoked (dotted) activity (n = 34 trials). Error bars signify ±1 s.e.m. Asterisks indicate significantly greater coherence during evoked activity (sign-rank test, p<0.05, corrected). B) Spectrograms displaying the change in inter-electrode coherence (ΔCxy) for spontaneous (top) and evoked (bottom) LFPs. ΔCxy is expressed as a percent change from baseline. C) Average ΔCxy for different time intervals and frequency bands. Significant changes in spontaneous (left) and evoked (right) coherence are denoted with asterisks (p<0.05, sign-rank test, corrected).