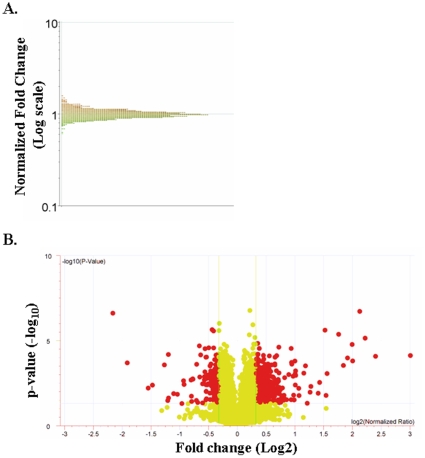
Figure 1. Gene distribution and volcano plots of differentially expressed genes in TNF-treated C2C12 myotubes.
A) Distribution curve of differentially expressed genes in response to TNF treatment detected by cDNA microarray analysis. The normalized fold changes were plotted on y-axis on logarithmic scale. B) Volcano plots of differentially expressed genes in response to TNF treatment. Here −log10 p-values were plotted on y-axis and log2 values of normalized ratios were plotted on x-axis.

