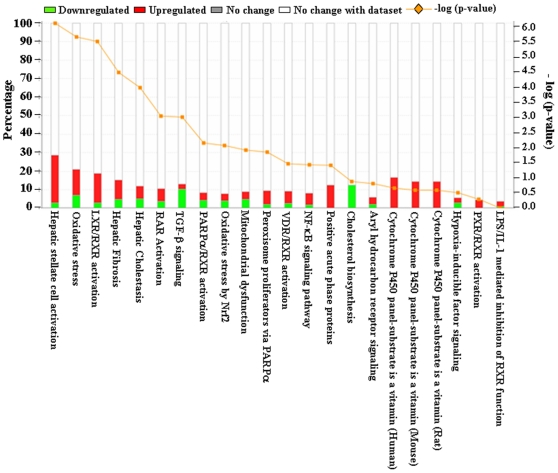
Figure 8. Differentially expressed genes associated with canonical pathway in the Ingenuity Pathway Analysis (IPA).
Top canonical pathways affected by TNF-α treatment were identified by using IPA analysis. Here the differentially regulated genes with p-value ≤0.05 and fold change ≥1.2 were considered for IPA analysis. Bars represent −log p-value and percentage of genes present in the data set compared to the total number of genes present in each selected pathway in IPA data base. The yellow line represents −log p-value of affected genes to the total number of genes in a pathway. Each bar was represented in two different colors in which red correspond to the up-regulated genes and green corresponds to down-regulated genes. The percentage of up-regulated and down-regulated genes in each selected canonical pathway can be measured in percentage scale given on y-axis (left side).

